California Academy of Science
Tropical Belt
Where in the world is the equator? Explore a world map with your class, coloring in oceans, continents, and rainforests while locating the three major lines of latitude: the equator, Tropic of Cancer, and Tropic of Capricorn. Discuss how...
Curated OER
Praire Biome Models
Fifth graders, in groups, list the physical characteristics of a biome and think of ways in which animals might have to adapt to live there and make a biome mobile ball that show the different types of habitats that shape the praire biome.
Curated OER
Exploring Microclimates
Students compare the land cover and temperatures in different microclimates to begin to explain why organisms live where they do. While exploring microclimates, students record temperature readings and detailed observations.
Curated OER
Weather Watchers
Students are introduced to an Underground Weather Stations. In groups, they use the internet to research the weather in different parts of the United States locating each city. To end the lesson plan, they summarize the information they...
Curated OER
Glaciers and Icebergs
Middle schoolers conduct an experiment on glacial scraping. In this glacial scraping lesson, students create a small glacier in a plastic cup. Middle schoolers remove the cup and scrape the glacier across wood and note the markings....
Curated OER
Paleoclimates and Pollen
Students analyze soil for types of pollen to determine the probably climate conditions. In this earth science instructional activity, students make conclusions on what a climate is like based on soils samples. Students use a model soil...
Curated OER
Places in My World
Second graders explore where they are located on the globe. In this maps and globes lesson, 2nd graders use a map to show where they live and show the cardinal directions. Students identify characteristics of mountains, flat land,...
Curated OER
Using Climographs to Compare and Contrast Two Climates
In this climographs worksheet, students use two given climographs to compare the climate of West Palm Beach and Katmandu. They answer questions about the climographs and about the similarities and differences between the two climates.
Curated OER
Using Vegetation, Precipitation, and Surface Temperature to Study Climate Zones
Students begin their examination of the climate zones found around the world. Using a software program, they identify the relationship between the vegetation, climate and temperatures of the different zones. They also plot coordinates...
Curated OER
Sub-Sahara Africa
Students listen to a lecture on the geography of sub-Sahara Africa. They then make a poster that illustrates the various landforms and climates that can be found in Africa. Students listen to a lecture on the diversity of African...
Curated OER
Engineering: Which Roof Is Tops?
Students determine regional climates by examining photos of house roofs. They observe teacher-constructed examples of roofs and make predictions as to which style is best for snowy climates. After evaluating the examples, they record...
Curated OER
The Good, The Bad and The Arctic
Students examine the impact of a major climate change in the Arctic Ocean on the rest of the world. They use the Internet to research the Arctic region and the wildlife that lives there.
Curated OER
Monsoon Asia
In this Asia map worksheet, learners label the countries on the provided blank outline map of Asia. The countries labelled should be countries that experience monsoons.
Curated OER
Comparing Climates - Three Ring Venn Diagram
In this Venn diagram worksheet, students read about the use of the graphic organizer to make comparisons. They compare three different climate types in the three rings of the diagram.
Curated OER
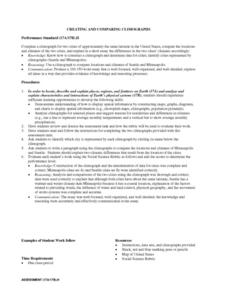
Creating and Comparing Climographs
Pupils are introduced to the importance and usefulness of climographs. In groups, they create a climograph of two cities on about the same latitude. They compare and contrast the locations and climates of the two cities and write a...
Curated OER
Thematic Unit on Cats
Students discover in which climates the cats of the world live in. They review the different climates of the world and use maps and globes to help them locate continents.
Curated OER
Habitats and All That
First graders read books, complete online explorations and discuss the ways in which animals adapt to their habitats in order to survive. They create accordion books, play matching games and dramatize animal adaptations.
Curated OER
California Regions
Fourth graders explore the four regions of California and compare and contrast them, and use pictures and research information to describe how regions vary in land use, vegetation, wildlife and climate.
Curated OER
Highs and Lows
Students use email to chart weather patterns and then graph their findings. In this weather patterns lesson, students chart their weather for a week at the school. Students then use email to find temperatures at a variety of locations....
Curated OER
Population Growth
Pupils discover how much the world population has grown and how much it is expected to grow. Using historical events, they discuss how they have impacted population and compare and contrast the current emission rates verses projected...
Curated OER
Let's Get To the Core!
Students practice analyzing ice core samples to discover climate changes. Using the samples, they identify and graph the gas amounts. They use these numbers to determine their effect on global warming. In pairs, they complete a...


