Curated OER
The Lady's Age
Students use a game to establish the context of solving problems in a systematic and mathematical fashion. They also solve various types of equations to find reasonable solutions.
Curated OER
Tortillas
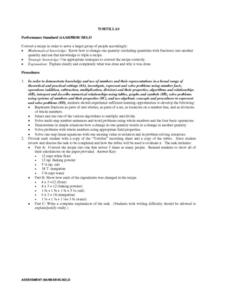
Students convert recipes for tortillas. They calculate the amounts of ingredients as they convert recipes and write an explanation of the task to demonstrate their calculations. After reviewing their calculations, they demonstrate how...
Curated OER
Conductivity of salt Solutions
Students investigate the concentration level of solutions. In this math/science lesson, students identify three different ionic compounds. They predict the conductivity of each using their collected data.
Curated OER
How High Are the Clouds?
Students analyze height and collect data to create a graph. In this statistics lesson, students use central tendencies to analyze their data and make predictions. They apply concept of statistics to other areas of academics to make a...
Curated OER
Inquiry Unit: Modeling Maximums and Minimums
Young mathematicians explore the maximun area for patio with the added complexity of finding the mimimum cost for construction. First, they maximize the area of a yard given a limited amount of fence and plot width v. area on a scatter...
Project Maths
Complex Number Operations
What do animated videos have to do with mathematics? Using operations of complex numbers and their representations on the complex plane, high schoolers observe how mathematics could be used to move animations. The lesson provides an...
Curated OER
Solving Absolute Value Inequalities
Start this activity with a brief description of how to solve absolute value inequalities. A space is provided to help classify the inequalities into types (greater than, less than, or equal to) and for learners to show how to graph their...
Curated OER
Means of Growth
Students collect and graph data. In this statistics lesson, students analyze their plotted data using a scatter plot. They identify lines as having positive, negative or no correlation.
Curated OER
Substitution and Elimination
In this substitution and elimination worksheet, students complete short answer problems for substitution and elimination and read notes about them as well. Students complete 13 problems.
Space Awareness
Valleys Deep and Mountains High
Sometimes the best view is from the farthest distance. Satellite imaging makes it possible to create altitude maps from far above the earth. A three-part activity has your young scientists play the role of the satellite and then use...
Curated OER
Introduction to Economics
Students develop the concept of supply and demand. In this economics lesson, students listen to a lecture and take notes on supply and demand. Students create a coherent set of notes about supply and demand.
Curated OER
Topic 5: Running the Business
Students explore the concept of running a business. In this running a business lesson, students put their plan of action into practice. Students market a product and try to maximize profit.
Curated OER
Topic 6: Evaluating and Presenting Results
Students construct spreadsheets from raw data. In this spreadsheet construction lesson, students compile data into Microsoft Excel. Students familiarize themselves with entering and presenting data in a spreadsheet.
Curated OER
Impossible Graphs
Young scholars practice plotting functions on the Cartesian coordinate plane while participating in a discussion about the Possible Or Not worksheet/activity. Students also use the Impossible Graphs worksheet to practice reading a graph,...
Curated OER
How Alike Are We?
Fourth graders find the range, mode, median, and mean for each of the data sets (height and shoe size). They discuss which measure of central tendency for each data set best represents the class and why. Students graph the shoe size and...
Curated OER
WINDMILL POWER
Students study operations with real numbers using mental computation or paper-and-pencil calculations. They judge the reasonableness of numerical computations and their results. They set up and solve proportions for direct and inverse...
Curated OER
Square Milk Bottle Crates
Students attempt a problem that Students has the potential to have more than one solution. Hence the problem is accessible to a wide range of students. The problem is essentially about finding patterns and this is typical of a number of...
Curated OER
The Old Chicken Run Problem
Sixth graders apply problem solving strategies to work with a real life situation in which they need to determine the area. They determine the area of chicken runs that are rectangular in shape when give a partial perimeter.
Curated OER
Polygonal Strings
Sixth graders apply knowledge of how to calculate the area and perimeter of triangles. They determine why it is inappropriate to measure the area of land by its perimeter which is done in certain areas of New Guinea. They complete a...
Curated OER
Flow Rates of Faucets and Rivers
Students work together to discover the flow rates of faucets and rivers. They relate their results to engineering and applied science concepts. They make predictions on the flow rate of a nearby river in their local community.
Curated OER
What Are The Chances
Students calculate the probability of an event occurring. In this probability instructional activity, students differentiate between independent, dependent or compound events. They find the range of the data.
Curated OER
Conjectures and Conclusions
Learners draw conclusions and make conjectures given a specific scenario. In this geometry lesson plan, students model real life scenarios using properties of triangles. They model number facts and explain why the outcome is what it is.
Curated OER
Impossible Graphs
Pupils distinguish between possible and impossible graphs of functions, and to learn why some graphs are impossible. They have practiced plotting functions on the Cartesian coordinate plane


