CK-12 Foundation
Graphs for Discrete and for Continuous Data: Discrete vs. Continuous Data
Not all data is the same. Using the interactive, pupils compare data represented in two different ways. The learners develop an understanding of the difference between discrete and continuous data and the different ways to represent each...
Curated OER
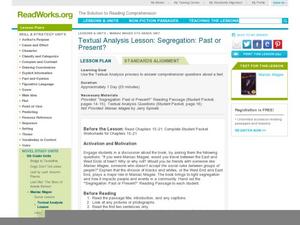
Textual Analysis Lesson: Segregation: Past or Present?
Are your scholars reading Jerry Spinelli's Maniac Magee? If so, use this textual analysis packet and lesson guide to drive deeper thinking about the characters, create personal connections, and apply historical contexts to the text....
National Wildlife Federation
The Tide is High, but I’m Holding On… Using ICESat Data to Investigate Sea Level Rise
Based on the rate of melting observed from 2003-2007 in Greenland, it would take less than 10 minutes to fill the Dallas Cowboys' Stadium. The 17th lesson in a series of 21 has scholars use the ICESat data to understand the ice mass...
Curated OER
Comparison of Univariate and Bivariate Data
Learners explore the concept of univariate and bivariate data. In this univaritate and bivariate data lesson, pupils discuss the differences between univariate and bivariate data. They work sample problems where they must construct box...
College Board
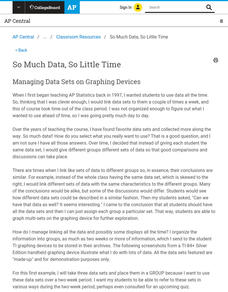
So Much Data, So Little Time
Organizing data in a statistics class is often a challenge. A veteran statistics teacher shares data organization tips in a lesson resource. The instructor shows how to group data to link to individual calculators in a more efficient...
Curated OER
Writing a Character Sketch
Combining descriptive and expository writing skills, middle schoolers create a character sketch about someone they know well. They use a graphic organizer to help them discuss a model character sketch and organize/write one of their own....
Curated OER
Estimate and Compare Data
Seventh graders explore the values that are used in order to describe data that is collected or given. They compare data using the statistical analysis provided by finding the mean, median, and range.
Curated OER
Many Ways to Represent Our Data
Demonstrate several ways to represent data with your class. They will use surveys to gather data and display the data using tally charts and graphs. Then answer questions according to the data.
Curated OER
Show Me The Data!
Pupils create a bar graph. They will collect and organize data to turn into bar graphs. They create graphs for the favorite sports of the class, color of M&M's, and types of cars passing by.
Howard Hughes Medical Institute
Gorongosa: Scientific Inquiry and Data Analysis
How does the scientific process begin? Introduce ecology scholars to scientific inquiry through an insightful, data-driven lesson. Partners examine data from an ongoing research study to determine the questions it answers. The resource...
Curated OER
Data Analysis
Young statisticians use and interpret measures of center and spread such as mean, median, and mode as well as range. They use box plots to represent their data and answer questions regarding the correspondence between data sets and the...
Curated OER
Data Analysis and Probability: Graphing Candy with Excel
Collect and graph data using Microsoft Excel with your math class. They will make predictions about the number of each colored candy in a bag of M&M's, then sort, classify, count, and record the actual data before using Excel to...
Centre for Innovation in Mathematics Teaching
Ten Data Analysis Activities
This thirteen page data analysis worksheet contains a number of interesting problems regarding statistics. The activities cover the concepts of average measurements, standard deviation, box and whisker plots, quartiles, frequency...
Curated OER
Focus on Economic Data: US Real GDP Growth, August 26, 2011
Young economists answer a series of critical thinking questions as they analyze real data that shows GDP Growth. They examine the provided charts, read through the background information, and discuss changes that occurred in the third...
Curated OER
Semantic Feature Analysis Chart: The Outsiders
Cool! Do you ned a way to increase vocabulary development and study a story's characters? What a great idea. Use this semantic analysis chart to study new vocabulary and the characters that appear in The Outsiders. You could also use...
Corbett Maths
Discrete and Continuous Data
Let's be discrete about the types of data. A short video provides the definitions of discrete and continuous data. After providing the definitions, the resource takes different types of data and sorts them based on type and provides an...
Corbett Maths
Quantitative and Qualitative Data
Classify the Big Ben of all data with a video that defines quantitative and qualitative data. Given data about Big Ben, the presenter classifies each piece based upon the definitions. In the Types of Data worksheet, individuals show they...
Curated OER
Reading Primary Source Documents: Historical Content
Why do we read primary source documents? What can they give us that other writings cannot? Provide your learners with any of the primary sources attached here (there are seven), and have them complete the graphic organizer (which opens...
Curated OER
Graphs that Represent Data Sets
These four scenarios all contain graphable data; can scholars match them to the correct bar graphs? All the data is in single-digit whole numbers. Some of the scenarios instruct kids to make a graph, while others don't. Clarify...
Houghton Mifflin Harcourt
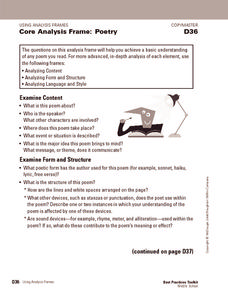
Core Analysis Frame: Poetry
Dig deep into any piece of poetry with a set of analysis questions. Ponder the content, form, and language of poetry and provide some question for critique. The first two pages include general questions, and the remainder of the document...
Curated OER
Data Analysis Challenge
In this data analysis worksheet, young scholars work with a partner to collect information for a survey. The information is then compiled into a graph. Students must indicate their survey question, the target audience, predict the...
Earth Watch Institute
Entering Local Groundhog Data in an Excel Spreadsheet
Here is a cross-curricular ecology and technology lesson; your learners create spreadsheets depicting the location and number of groundhog dens in a local park. They research groundhogs and analyze data about where the groundhog...
Curated OER
Worksheet for Analysis of a Letter
Dear Nancy, how do you analyze a letter? Love, Trez. Dear Trez, you use a Letter Analysis Worksheet. Love, Nancy.
This richly detailed worksheet provides multiple questions that lead researchers step-by-step through the process of...
Curated OER
Document Analysis Sheet
Sometimes all kids need is a little guided practice and then they can be on their way. They can use an analysis worksheet to help them analyze a primary or secondary source document. They answer several questions describing the type of...
Other popular searches
- Data Analysis
- Literary Analysis
- Character Analysis
- Poetry Analysis
- Data
- Data, Census, & Statistics
- Character Sketch
- Word Analysis
- Analyzing Poetry
- Thinking Analysis
- Dimensional Analysis
- Analysis Song Lyrics


