Inside Mathematics
Scatter Diagram
It is positive that how one performs on the first test relates to their performance on the second test. The three-question assessment has class members read and analyze a scatter plot of test scores. They must determine whether...
Curated OER
Little House in the Census: Almanzo and Laura Ingalls Wilder
How would you use census data from 1880-1900? Here are a set of ways you can incorporate the book Little House on the Prairie and US census data from that time period. Learners will research the validity or the book based on factual...
Curated OER
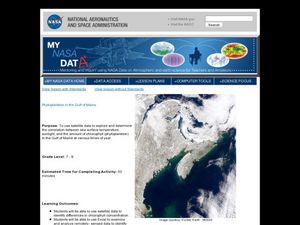
Phytoplankton in the Gulf of Maine
Students use satellite data to see the correlation between sea temperature and sunlight in the Gulf of Maine. In this phytoplankton lesson students use Excel to analyze data.
Redefining Progress
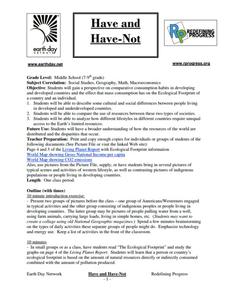
Have and Have-Not
Is there a correlation between a country's wealth and the extent of its ecological footprint? What exactly constitutes an ecological footprint, and how does one country stack up against the rest? This is a unique lesson to incorporate...
Curated OER
A Closer look at Oil and Energy Consumption
Upper graders analyze basic concepts about the consumption, importation and exportation of the worlds oil production. They create several graphs to organize the data and draw conclusions about the overall use of oil in the world.
Teach Engineering
The Challenge Question
A research position becomes a modeling job. The introductory lesson in a series of nine presents the challenge of analyzing a set of bivariate data. The class brainstorms what the data may represent. Pupils must decide what is needed to...
Inside Mathematics
Snakes
Get a line on the snakes. The assessment task requires the class to determine the species of unknown snakes based upon collected data. Individuals analyze two scatter plots and determine the most likely species for five additional data...
Polar Trec
What Can We Learn from Sediments?
Varve: a deposit of cyclical sediments that help scientists determine historical climates. Individuals analyze the topography of a region and then study varve datasets from the same area. Using this information, they determine the...
Curated OER
Global Warming
A series of independent learning activities teaches learners about global warming as it relates to economics and industrialization. The culminating project requires them to create a multimedia presentation identifying the problems,...
Curated OER
Fast Talker - Ch 2 project
Tongue Twisters?! Create scatter plot graphs based on timing fellow classmates saying tongue twisters. Then investigate, display, and analyze the relationships based on functions. Wrap up this activity by making a poster or other...
Teach Engineering
A Shot Under Pressure
You've got to pump it up! Using the equations for projectile motion and Bernoulli's Principle, class members calculate the water pressure in a water gun. The pupils collect data on the number of pumps and distance traveled in order to...
Inside Mathematics
Coffee
There are many ways to correlate coffee to life, but in this case a worksheet looks at the price of two different sizes of coffee. It requires interpreting a graph with two unknown variables, in this case the price, and solving for those...
University of Texas
Matter and the Periodic Table Chemical Families and Periodic Trends
Is assembling the periodic table as simple as Tetris? Scholars arrange colored cards into a logical order and then make connections to the arrangement of the periodic table. Hands-on activities include adding trend arrows and analyzing...
Facing History and Ourselves
Do You Take the Oath?
Why did so many go along with Nazi policies during World War II? An investigatory unit includes four handouts, reading analyses, classroom discussion topics, and intriguing philosophical questions, helping learners understand the...
Institute for Humane Education
I've Been Branded!
How many pairs of Nikes® or Apple® products are in the average American home? What makes someone buy one particular type of laundry detergent over another? Scholars grapple with these questions as they develop a list of brands they use...
Curated OER
Hear Ye, Hear Ye: Read All About It!
Develop an online newspaper covering the Lewis and Clark Expedition. The class publishes their newspaper on the school's Web site and analyze both primary and secondary sources.
Curated OER
Growing a Nation
Eleventh graders examine the Dust Bowl in American History. In this US History lesson, 11th graders read a transcript on the Dust Bowl. Students analyze a video on the Dust Bowl.
Curated OER
Schools Going Solar
If your school has a photovoltaic system, you can use this lesson plan to guide learners through an investigation of the factors affecting performance. Familiarize yourself with the data acquisition system, and then provide data for your...
National Institute of Open Schooling
Solid State
Crystal comes from a Greek word meaning ice. Activity eight in a series of 36 has class members analyzing amorphous and crystalline solids and further classifying them based on their forces. They then explore solids, learning about unit...
Curated OER
Analyzing Civil War Pictorial Envelopes
Students explore the power of political messages contained in visual artifacts and examine the political messages conveyed by the illustrations that appeared on personal stationery used during the Civil War. They create and describe a...
Howard Hughes Medical Institute
Mapping Genes to Traits in Dogs Using SNPs
Genetic analysis has gone to the dogs! Learners use real DNA information collected from dog saliva to study the relationship between genotypes and phenotypes. They analyze alleles to determine correlations to coat color, length, and...
Curated OER
All the World's a Stage
Is the circus a form of theater? Read "A City of Clowns? What Else Is New?" to sway your class that a circus, is indeed, a theatrical performance. Critical thinkers compare/contrast various forms of theater and identify what makes the...
Curated OER
Saving Sturgeon
Marine biology apprentices interpret data of sturgeon interaction with gill nets. They use the data to calculate the percentage of fish entangled in each twine size to discover if there is any correlation. This is a valuable exercise in...
Curated OER
Scatter-Brained
Seventh graders graph ordered pairs on a coordinate plane. They create a scatterplot. Additionally, they determine the line of best fit and investigate the slope of the line. Multiple resources are provided. An excellent resource!


