Curated OER
Charts and Graphs
Fifth graders interpret data into graphs and percentages. In this organizing data lesson plan, 5th graders discuss bar, circle and line graphs. Students complete bar graph and apply probability using the results.
Curated OER
Organizing Data
In this organizing data worksheet, 7th graders solve seven different types of problems related to data. They first identify the type of data as categorical, discrete or continuous from the information given. Then, students use Excel to...
Curated OER
Understanding Statistics
In this statistics worksheet, students examine and interpret pictographs and line graphs. Students analyze the provided data in order to create bar graphs, circle graphs, and box and whisker plots. The nine page worksheet accompanies a...
Curated OER
Graphing
Students collect data to create different types of graphs-line, pie, and bar graphs. They use StarOffice 6.0 to create graphs.
Curated OER
Statistics for Graphing
Students use the Internet to access a variety of websites that present statistics and information for use in graphing. They represent sports statistics, geographical measurements, temperatures and more.
Curated OER
Dealing With Data
Learners collect, organize, and display data using a bar graph, line graph, pie graph, or picture graph. They write a summary describing the data represented and compare the graph to another graph in the class.
Curated OER
Graphing With Candy
Students gather information and interpret the results using a tally chart, a table, and a bar graph.
Curated OER
Human Population Growth
In this human population growth worksheet, students create a graph of human population growth and predict future growth using the data given in a chart. Students identify factors that affect population growth.
Curated OER
Graphing Data Brings Understanding
Learners collect, graph and analyze data. In this statistics lesson plan, students use circle, pie, bar and lines to represent data. They analyze the data and make predictions bases on the scatter plots created.
Curated OER
Graphing Using Cookies
Pupils differentiate between bar graphs, line graphs, pictographs and bar graphs. After participating in a hands-on cookie activity, students label and draw their own graphs.
Curated OER
Graphing with Stems-and -Leafs
Fourth graders examine the use of stem and leaf graphs. For this stem and leaf graph lesson, 4th graders participate in teacher led lesson showing the use of the graphs. They work in groups to collect data about peanuts before making a...
Curated OER
Creating Line Graphs
High schoolers draw line graphs. In this math lesson, students interpret minimum wage data and graph the data in a line graph. High schoolers predict the next minimum wage and figure the earnings for a 40 hour work week for someone...
Curated OER
Let's Line Them Up!
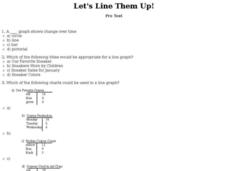
In this line graph instructional activity, students read through the problems about graphing and line graphs. Students select the best answer to solve the 10 online questions.
Curated OER
Graph Frenzy!!
Students brainstorm for a survey question to ask classmates. They survey their classmates. They enter the results into a spreadsheet and create the best graph for the information. They share their graphs with the class.
Curated OER
Many Ways to Represent Our Data
Demonstrate several ways to represent data with your class. They will use surveys to gather data and display the data using tally charts and graphs. Then answer questions according to the data.
Curated OER
Data Analysis and Probability
Students make their own puzzle grid that illustrates the number of sit-ups students in a gym class did in one minute, then they make a histogram for this same data. Then they title their graph and label the scales and axes and graph the...
Curated OER
Graphing Lesson Plans
By using hands-on graphing lesson plans students can learn how to collect data, and display the information using graphs.
Curated OER
Speed
Fifth and sixth graders practice working in pairs to determine whether they can walk with constant speed. They test themselves, collect their data, draw graphs with their data collected, manipulate the data, and then draw conclusions...
Curated OER
Introductory Algebra Chapter 3 Review
In this math worksheet, middle schoolers find the solutions to the problems while interpreting the line, bar, and circle graphs. The examples are given to help in the context of each objective.
Virginia Department of Education
May I Have Fries with That?
Not all pie graphs are about pies. The class conducts a survey on favorite fast food categories in a lesson on data representation. Pupils use the results to create a circle graph.
Curated OER
Great Graphing
Young scholars collect data, use a computer spreadsheet program to create various graphs, and compare the graphs. They state the findings of each graph in writing and decide which graph type best represents the data.
Curated OER
Graphs and money
In this graphs and money worksheet, students complete word problems about different kinds of graphs and money in those graphs. Students complete 10 multiple choice problems.
Curated OER
"Graph It"
Students work in teams to conduct short surveys of their classmates. They show their results using at least two different types of graphs.
Students separate into teams and are asked that each team to choose something that they are...
Curated OER
Usage and Interpretation of Graphs
Students review graphing and use processing skills to solve problems.


