Curated OER
Business & Statistics: Final Exam
In this business and statistics worksheet, young scholars read real-life business problems, arrange data, and identify the probability method best used to determine the answer. They identify the type of random sample, draw stem-and-leaf...
Curated OER
What Are The Chances
Students calculate the probability of an event occurring. In this probability instructional activity, students differentiate between independent, dependent or compound events. They find the range of the data.
Curated OER
Univariate Data Analysis
Students use given data to compare baseball players. They create box and whisker plots to compare the players and determine which they feel is the best player. Students use calculators to make box and whisker plots. They write paragraphs...
Curated OER
Data Analysis
Students examine techniques to represent data. In this data analysis lesson, students read about various ways to represent data, such as a stem and leaf diagram and calculating standard deviation. Students complete data analysis...
Curated OER
Data Analysis
Young statisticians use and interpret measures of center and spread such as mean, median, and mode as well as range. They use box plots to represent their data and answer questions regarding the correspondence between data sets and the...
Beyond Benign
Can You Hear Me Now? Cell Phone Accounts
How sustainable are cell phones? Throughout the unit, learners explore the issues around cell phones concerning sustainability. Class members take a graphical look at the number of cell phones across the world using a box-and-whisker...
EngageNY
Describing the Center of a Distribution Using the Median
Find the point that splits the data. The lesson presents to scholars the definition of the median through a teacher-led discussion. The pupils use data lists and dot plots to determine the median in sets with even and odd number of data...
Curated OER
Mean, Median, Mode, etc.
Explore the concept of mean, median, and mode with pupils. They estimate the length of a string or the number of M&M's in a jar. Then find the mean, median, and mode of the class' estimates.
Curated OER
Who's got the fastest legs?
Students use a stopwatch to collect information for a scatterplot. In this fastest legs lessons, students collect data through the taking of measurements, create and find a median number. Students develop an equation and answer...
Curated OER
Integrate Algebra Regents Exam Bimodal Questions Worksheet #1
For this Integrated Algebra worksheet, students solve problems that reflect the topics covered during the course of work. The answer key identifies each question by standard and topic. The twenty-four page worksheet contains two...
Curated OER
Box and Whisker Plots
Seventh graders explore the concept of box and whisker plots. In this box and whisker plots instructional activity, 7th graders plot data on a box and whisker plot. Students discuss the mean, median, and mode of the data. Students...
Curated OER
Comparison of Two Different Gender Sports Teams - Part 1 of 3 Measures of Central Tendency
Students gather and analyze data from sports teams. In this measures of central tendency instructional activity, students gather information from websites about sports team performance. Students analyze and draw conclusions from this...
Curated OER
Salaries
Students are engaged in the study of salaries and how they vary according to different occupations. They conduct research using a variety of resources in order to summarize the earnings potential in the human services field.
Curated OER
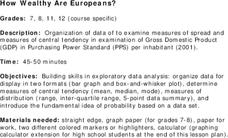
How Wealthy Are Europeans?
Students investigate measures of central tendency. They examine compiled data and conduct critical analysis. The graph is focusing on the gross domestic product data. The lesson also reviews the concept of putting values in order of...


