EngageNY
End-of-Module Assessment Task: Grade 8 Mathematics (Module 7)
It's time to discover what your classes have learned! The final lesson in the 25-part module is an assessment that covers the Pythagorean Theorem. Application of the theorem includes distance between points, the volume of...
EngageNY
Calculating Probabilities of Events Using Two-Way Tables
Tables are useful for more than just eating. Learners use tables to organize data and calculate probabilities and conditional probabilities.
EngageNY
Sampling Variability in the Sample Proportion (part 2)
Increase your sample and increase your accuracy! Scholars complete an activity that compares sample size to variability in results. Learners realize that the greater the sample size, the smaller the range in the distribution of sample...
Teach Engineering
How Big? Necessary Area and Volume for Shelter
Teams must determine the size of cavern needed to house the citizens of Alabraska to protect them from the asteroid impact. Using scaling properties, teams first determining the number of people that could sleep in a classroom and then...
EngageNY
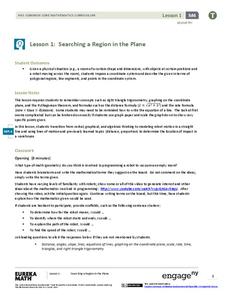
Searching a Region in the Plane
Programming a robot is a mathematical task! The activity asks learners to examine the process of programming a robot to vacuum a room. They use a coordinate plane to model the room, write equations to represent movement, determine the...
EngageNY
Sampling Variability in the Sample Mean (part 2)
Reduce variability for more accurate statistics. Through simulation, learners examine sample data and calculate a sample mean. They understand that increasing the number of samples creates results that are more representative of the...
EngageNY
Nonlinear Models in a Data Context
How well does your garden grow? Model the growth of dahlias with nonlinear functions. In the instructional activity, scholars build on their understanding of mathematical models with nonlinear models. They look at dahlias growing in...
Illustrative Mathematics
Paper Clip
With minimal setup and maximum freedom, young geometers are encouraged to think outside the box on a seemingly simple application problem. Though the task seems simple, measuring a given paper clip and finding how many 10 meters can...
Illustrative Mathematics
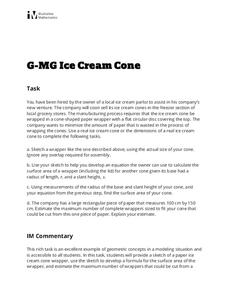
Ice Cream Cone
Every pupil with a sweet tooth will be clamoring for this lab and analysis, particularly when they're allowed to eat the results! Volume and surface area formulas for cones are developed from models, and then extended to the printing of...
NASA
Rocket Wind Tunnel
Using a teacher-built wind tunnel constructed from a paper concrete tube form, a fan, and a balance, individuals determine the amount of drag their rocket design will experience in flight. Pupils make modifications to increase the...
EngageNY
Perimeter and Area of Polygonal Regions in the Cartesian Plane
How many sides does that polygon have? Building directly from instructional activity number eight in this series, learners now find the area and perimeter of any polygon on the coordinate plane. They decompose the polygons into triangles...
EngageNY
Describing a Distribution Displayed in a Histogram
The shape of the histogram is also relative. Learners calculate relative frequencies from frequency tables and create relative frequency histograms. The scholars compare the histograms made from frequencies to those made from relative...
Space Awareness
Navigation in the Ancient Mediterranean and Beyond
Ancient texts, like Homer's Odyssey, mentions navigating ships by observing constellations. Pupils learn about the link between history and astronomy as they relate to navigation in the Bronze Age. Scholars complete two hands-on...
EngageNY
Vectors in the Coordinate Plane
Examine the meaning and purpose of vectors. Use the lesson to teach your classes how find the magnitude of a vector and what it represents graphically. Your pupils will also combine vectors to find a resultant vector and interpret its...
Texas Instruments
TI-Nspire™ CAS
When it comes to rating educational calculators, this calculator is always near the top of this list. Now it's available as an app. There is a lot of calculator power wrapped up in this app. Not only is this a fully functioning...
Texas Instruments
TI-Nspire™
We landed on the moon with less computing capabilities than you can find in this app! Here is a multiple function calculator that takes all the power you get from a handheld and adds the wonderful large screen that only a tablet can...
Curated OER
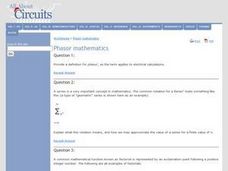
Phasor Mathematics
In this mathematics learning exercise, students solve 13 questions on series, factorial, phase mathematics and calculus. They define what phasor means.
Illustrative Mathematics
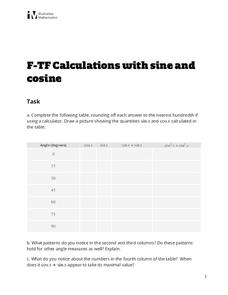
Calculations with Sine and Cosine
Practice makes perfect and perfecting those trigonometric functions are vital in trigonometry. The task requires evaluating cosine and sine values at common degree measures before looking at the results. Is there a pattern when the...
Texas Instruments
Drawing a Line Tangent to a Circle
Explore lines tangent to a circle. In this math lesson plan, high schoolers manipulate circles and lines on a TI calculator. They draw a circle and analyze perpendicular lines intersecting the circle in only one place. This activity...
EngageNY
The Graph of the Natural Logarithm Function
If two is company and three's a crowd, then what's e? Scholars observe how changes in the base affect the graph of a logarithmic function. They then graph the natural logarithm function and learn that all logarithmic functions can be...
Mathed Up!
Area and Circumference of Circles
Don't go around and around, help your class determine amounts around and in a circle with a video that connects circumference to the perimeter or the distance around an object. The resource includes 14 questions dealing with circles and...
Illustrative Mathematics
How Thick Is a Soda Can I?
The humble soda can gets the geometric treatment in an activity that links math and science calculations. After a few basic assumptions are made and discussed, surface area calculations combine with density information to develop an...
EngageNY
Modeling a Context from a Verbal Description (part 2)
I got a different answer, are they both correct? While working through modeling problems interpreting graphs, the question of precision is brought into the discussion. Problems are presented in which a precise answer is needed and others...
Curated OER
Concepts in Precalculus 1: Trigonometry
Students investigate trigonometry. In this Algebra II/Pre-calculus/Trigonometry lesson, students explore Islamic achievements in mathematics as they calculate angles and distances using the Law of Sines and the Law of Cosines. ...


