Curated OER
Data Management and Probability: Applications
For this data management and probability applications worksheet, 8th graders solve 20 various types of probability problems. They find the mean, median, mode and range of various numbers. Then, students use the spinner illustration to...
American Institutes for Research
Data and Probability: Marshmallow Madness
Upper grade and middle schoolers make predictions, collect data, and interpret the data as it relates to the concept of probability. They work with a partner tossing marshmallows and recording if they land on their side or on their...
Curated OER
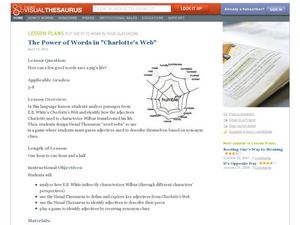
The Power of Words in Charlotte's Web
"How can a few good words save a pig's life?" Posed with this question, your ELD students explore E.B. White's Charlotte's Web in a meaningful, valuable way. By analyzing specific word choice from the book, especially the excerpts...
Curated OER
Representing Data
Second and third graders answer questions based on data presented to them in graphs. They see how to interpret data from a bar graph, line graph, and a chart.
Curated OER
Interpreting and Displaying Sets of Data
Students explore the concept of interpreting data. In this interpreting data lesson, students make a line plot of themselves according to the number of cubes they can hold in their hand. Students create their own data to graph and...
EduGAINs
Data Management
Using a carousel activity, class members gain an understanding of the idea of inferences by using pictures then connecting them to mathematics. Groups discuss their individual problems prior to sharing them with the entire class. The...
C-SPAN
Why Do Americans Not Vote in Elections?
In an age of inflamed politics, who votes, who doesn't vote, and why are the questions everyone is trying to answer. Pupils listen to scholars, journalists and data crunchers on voting statistics to make their own conclusions. A chart...
EngageNY
Grade 9 ELA Module 2, Unit 2, Lesson 20
Oedipus' lack of literal and figurative vision does not mean he cannot see his guilt in the terrible fates of Laius, Jocasta, and all the lives touched by prophecy. Conclude a literary analysis unit on Sophocles' Oedipus the King with a...
NASA
Using Models in Climate Change Research
Explore models through the relevant lens of climate change! Investigators watch a video about using models and their application for evaluating temperature data and climate change. Scientists read an article on climate change and answer...
Curated OER
Graphing Data
Seventh graders solve and graph 10 different problems that include various questions related to data on a graph. First, they create bar graphs to display the data given. Then, pupils determine the random sample of a population listing...
Curated OER
Where We Live
Who has the most? Young learners practice charting data using familiar information. They help fill out a classroom chart by recording the number of people, pets, televisions, etc. in their home. Guiding questions help them investigate...
Curated OER
Data Collection and Presentation
Middle and high schoolers collect and analyze data from four different activities. The activities include information about classmates, tallying colors of cars in a parking lot, stem and leaf plots, and making a histogram from winning...
Curated OER
Cutting Expenses
Students explore budgeting. In this finance and math lesson, students brainstorm ways in which households could save money. Students view websites that give cost reducing ideas. Students complete an expense comparison chart and use the...
Illustrative Mathematics
Favorite Ice Cream Flavor
What better way to engage children in a math instructional activity than by talking about ice cream? Using a pocket chart or piece of chart paper, the class works together creating a bar graph of the their favorite ice cream flavors....
Curated OER
Did Voters Turn Out -- or Are They Turned Off?
What was the voter turnout at your last state election? Examine voter turnout statistics from the most recent election to learn which ten states have the best turnout record. This lesson offers election data, handouts, and worksheets.
Curated OER
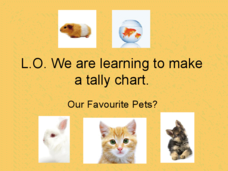
Pet Tally
Give the class an opportunity to practice using tally marks as a way to collect data. As you progress through the slide show, learners tally up the number and types of pets they see, they then use their data to create a tally chart....
Curated OER
Applying KWL Guides to Sources with Elementary Students
What is a KWL chart? Here is a well thought-out activity that has learners use KWL charts to gain historical perspective. Your class examines primary sources about historical events and identifies what they know, want to know, and,...
Curated OER
Reading Bar Charts
Help kids understand how to collect data through surveys, organize data in a bar chart, then analyze their findings. There are three different surveys for learners to conduct, a full description of all the parts of a bar chart, and three...
Curated OER
Build a Bar Graph
Learners discover how to use bar graphs. They will gather and organize specific data in order to put it into a bar graph. Then they will answer several questions based on the information they have graphed.
Curated OER
"Blackbeard's Ghost" Differentiated Lesson Plan
Develop a better understanding of "Blackbeard's Ghost" with this differentiated activity. Working in groups on a creative project, middle schoolers can reinforce their reading comprehension and literary analysis skills. Use this activity...
Curated OER
Tables and Graphs
Help pupils read graphs and tables with these examples and data comprehension questions. First they examine a bar graph to answer five analysis prompts. Note this graph doesn't have a label along the y-axis, so you may want to do this...
Curated OER
Phineas Gage: Personal Phrenology Chart During Reading Activity
Phrenology, the belief that parts of your brain control certain aspects of your personality, is described in Phineas Gage: A Gruesome but True Story About Brain Science. While we now know much more about the brain, learners use this idea...
Curated OER
What a Character!
Middle schoolers read a novel and discuss character personality. First, they analyze a character in a novel and keep a chart or web of the character's identity, which includes specific examples from the book. They then write a script...
EngageNY
Discovering the Topic: Inferring and Confirming Using Evidence
Allow your class to figure out what they will be studying through an inquiry-based anticipatory set that involves analysis of mystery documents and practice with making inferences. The lesson plan document includes a detailed description...


