Curated OER
Measuring the Area of a Circle
When mathematical errors happen, part of the learning is to figure out how it affects the rest of your calculations. The activity has your mathematicians solving for the area of a circular pipe and taking into consideration any errors...
Curated OER
Circle Up Your M&Ms
Fifth graders estimate how many M&Ms are in a pre-counted bag. They determine how many colored M&Ms are in a bag, then decide which of the two, bar graph or circle graph (in this case, circle graph) would be best to show te results.
Mascil Project
Circular Pave-Stones Backyard
Pack the lesson into your plans. Young mathematicians learn about packing and optimization with the context of circular paving stones. They use coins to model the paving stones, and then apply knowledge of circles and polygons to...
Curated OER
7th Grade Math Circle Graphs
Seventh graders are able to develop (synthesis) pie graphs with the class and on their own. They are told that pie charts are a graphic representation of material that can be given in the form of parts of a whole by using...
Virginia Department of Education
May I Have Fries with That?
Not all pie graphs are about pies. The class conducts a survey on favorite fast food categories in a lesson plan on data representation. Pupils use the results to create a circle graph.
Curated OER
Stretching the Truth
Sixth graders visualize different percentages as parts of a whole on visual images. They observe alterations of photographs, and models of circles, squares and sets. This incredibly detailed, eight-page plan leads you through everything...
Curated OER
What's in a Number? Analyzing Smoking Statistics
Sixth and seventh graders analyze smoking statistics. In this health lesson, learners look at the percentage of people who smoke from each race group. They create a bar graph and circle graph that displays this information.
Curated OER
Our Solar System - Comparing Planetary Travel Distances
NASA presents a mini-unit on distances in our solar system. It incorporates scientific concepts of gravity, mass, density, and payload while your aspiring astronauts also employ mathematics skills. They calculate speed, they determine...
Curated OER
Time Management: Piece of Pie
Middle schoolers examine their own lives and how well they manage their time outside of school. For this this time management lesson, students discover the amount of time they spend on other activities, and create a pie chart with that...
National Security Agency
Partying with Proportions and Percents
Examine ratios and proportions in several real-world scenarios. Children will calculate unit rates, work with proportions and percentages as they plan a party, purchase produce, and take a tally. This lesson plan recommends five...
Museum of Tolerance
Why is This True?
Are wages based on race? On gender? Class members research wages for workers according to race and gender, create graphs and charts of their data, and compute differences by percentages. They then share their findings with adults and...
Jason Learning
Tech in the Cycle
It might not be easy, but it is worth recycling electronics. Small groups determine the percentage of the materials that make up an iPad 2 and display the information in a circle graph. They then research the recycling process for...
EngageNY
Markup and Markdown Problems
There is a 100 percent chance this resource will help pupils connect percents to financial literacy. Young mathematicians use their knowledge of percents to find markups and markdowns in financial situations in the seventh segment in a...
Curated OER
Arc Length and Sectors
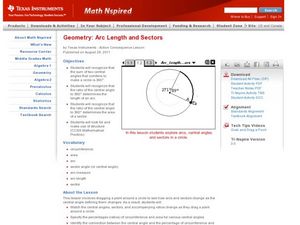
Find the length of an arc. Students relate central angles to the area and length of a sector and graph circles on the TI to make predictions.
Curated OER
Charts and Graphs
Fifth graders interpret data into graphs and percentages. In this organizing data lesson, 5th graders discuss bar, circle and line graphs. Students complete bar graph and apply probability using the results.
Illustrative Mathematics
Overlapping Squares
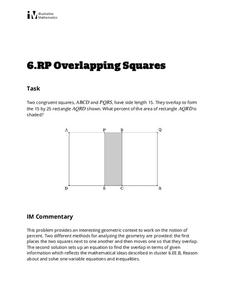
The objective of this activity is to find the percent of the area of a two squares overlapping. Mathematicians find the ratio of area for the part that overlaps to the rectangle formed. The final answer is a percent as a rate per 100....
Curated OER
Science and Cloning
Here is an ambitious lesson which has learners take a look at which nations came up with the most important scientific inventions/advancements during the 20th century. Focusing on group work, cloning is explored. All of the worksheets...
Curated OER
Seaside Science
Learners research sea life using laptop computers. In this sea life lesson plan, students participate in a field trip to the beach and enter observations into their laptop computers. Learners classify shells and sea life.
Curated OER
The Good, The Bad, The Ugly
Sixth graders examine the causes of the stock market crash of 1929. For this integrated math/history unit on the stock market, 6th graders study, research, and read stocks, visit a local bank, and create a PowerPoint to show the...
Curated OER
Pen Light Lab
Students study what makes Earth warm and explore how different locations on the planetreceive different amounts of solar energy based on the intensity of the sun's rays. They calculate light intensities and compare the
amounts of light...
Curated OER
Trash a Pizza!
Students investigate data about America's trash production. In this environmental lesson, students use statistics about what we throw away to create an art pie chart project called a "trash pizza."
Curated OER
Measuring the Earth (Eratoshenes' method)
Sixth graders engage in problem solving, communicating, reasoning, and connecting to represent and solve problems, using geometric models.
Curated OER
Graphing
Students collect data to create different types of graphs-line, pie, and bar graphs. They use StarOffice 6.0 to create graphs.
Curated OER
A Recipe for Air
Students create a pie graph using M&Ms to demonstrate the composition of air. They label each section of the graph, and list the fractions from largest to smallest.


