Curated OER
Where Are the Bugs?
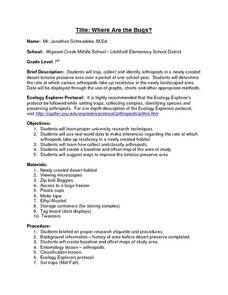
Students trap, collect and identify arthropods in a newly created desert tortoise preserve area over a period of one school year. They determine the rate at which various arthropods take up residence in the newly landscaped area. Data is...
Curated OER
Will It Sink Or Float?
Have your class predict whether objects will sink or float in water. Learners consider a data table of mass, volume and whether the object sank or floated. They develop an evidence-based explanation for the results.
Curated OER
Taste the Rainbow
Students practice estimating and graphing by utilizing Skittles. For this statistics lesson, students complete worksheets based on the likelihood of a certain color of skittle coming out of the bag. Students create a graph based on the...
Curated OER
Classify the Microbes
Students classify microorganisms into categories based on their characteristics. Pupils use a taxonomic key to identify organisms. They classify certain bacteria, protists, and viruses using a classification or taxonmic key.
Curated OER
Star Light, Star Bright: Exploring How Stars are Classified
In this star classification learning exercise, learners are given laminated star charts to make observations about stars. They work in groups to classify groups of stars based on different characteristics. For each group of stars they...
Curated OER
Collecting and Classifying Pollen
Students collect and analyze pollen from different species of plants. In small groups, they classify pollen according to shape, size and physical characteristics. They draw the basic anatomy of flowering plants and create a dichotomous...
Curated OER
Tracks are for Trains
Second graders collect data on different forms of transportation and create a bar graph or pictograph with the information.
Curated OER
A Day at the Beach
Student read Sheryl Wilson's story, "A Day at the Beach" while classifying items they find. They design a chart of the items before using educational graphing software to create a graph.
Curated OER
Traditional Weather Observations
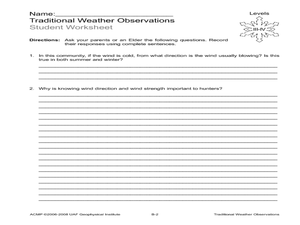
Students explore traditional methods of weather observation. In this weather lesson plan, students interview grown-ups regarding wind. Students learn how winds can help forecast weather.
Curated OER
Mmm, Mmm, M&M's
Here is another version of the classic M&M math lesson. In this one, upper graders utilize the ClarisWorks Spreadsheet program in order to document the data they come up with from their bags of M&M's. After making their initial...
Curated OER
Soil Porosity, Moisture Content, pH, and Density
This lab activity does not have to be done with AP environmental scientists. It can also be done with middle to high school earth scientists. The procedures aren't complex. Learners determine the density of dry and wet sand in order to...
Curated OER
Bodacious Buttons
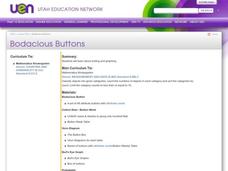
First graders graph a data set. Given a set of buttons, 1st graders sort them into categories using specific attributes. They graph the number of buttons in their set based on their attributes using a variety of graphs. Students share...
Curated OER
Charting the Changes in Our School Forest
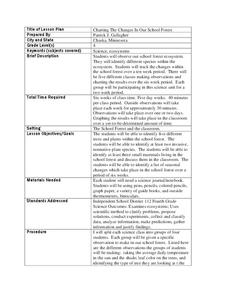
Fourth graders investigate the ecosystem and how forests are disappearing. In this environmental protection lesson, 4th graders analyze the changes in their school for 2 weeks. Students practice identifying trees, birds, and foliage...
Cornell University
Glued into Science—Classifying Polymers
Explore the unique characteristics of polymers. A complete activity begins with a presentation introducing polymers. Following the presentation, young scientists develop a laboratory plan for creating substances using polymers. They test...
Teach Engineering
Rocks, Rocks, Rocks: Test, Identify Properties and Classify
Time is growing short. Teams work together to identify physical properties of rocks in order to determine the properties that would best suit their cavern shelter design.
Curated OER
Sampling Rocks
Students examine how to take a sample by looking at rocks in the schoolyard. In this sampling instructional activity, students discuss ways to classify rocks by color, size, and weight. They think about how many rocks would make a good...
Curated OER
Classifying Materials
Students collect data and make observations on how given element samples respond to the field of a magnet and they calculate the density of the samples by finding the mass and volume.
Curated OER
Climate Change
Students compare weather data and draw conclusions. In this climate change lesson plan, students determine whether data collected over a period of ninety years shows a warming trend.
Curated OER
Ecosystems at School
In this ecosystem worksheet, students use a string and make a large circle. Everything in the circle is part of the ecosystem the students will study. They identify everything in their ecosystem and classify their data. They answer 2...
Curated OER
Hurricane Frequency: Identifying Regions with Similar Numbers of Hurricanes
In this earth science worksheet, students answer 6 questions about the hurricane map and data provided. They create a data table based on the information provided on the map.
Curated OER
Water Cycle, Weather, and Climate
Eighth graders investigate the water cycle and its processes. They examine temperature and precipiation data to classify climate of ten cities. They then create a climate map of the world.
Curated OER
Fruit Loop Graphing
Fifth graders interpret data and create graphs. Given Fruit Loops, they sort and classify according to color. Using spreadsheet technology, 5th graders record their data and create bar and circle graphs. Students analyze data and...
Curated OER
Counting Candies
Learners count, sort, and classify jellybeans by color. They use their data to create a bar graph. Students are given a small bag of jellybeans, and a worksheet on Counting Candies Tally Chart. They work in small groups. Learners are...
Curated OER
Classification of Cerealites
Students create a dichotomous key. In this categorizing lesson, students create a dichotomous key for different types of cereal. Students classify the cereal into groups such as flakes and cereal with holes. Students discuss their...


