Curated OER
Dog Days or Dog Years?
In need of some algebraic fun with real world implications?Learners use ordered pairs, a table of values and a scatter plot to evaluate the validity of several real world data sets. The class focuses on dog ages in human years, domain,...
Curated OER
Exploring Graphs of Inequalities
Learn how to solve inequalities and graph their answers. Students use addition, subtraction, multiplication and division to solve problems. They analyze their graph using the TI calculator.
Curated OER
Solving Systems by Graphing
Solve systems of equations with your super smart upper graders. They solve systems of equations and then graph two lines to find where they intersect. The focus on the activity is to have learners explore moving a point to illustrate...
Curated OER
Transformations of Functions 2
Solving problems on the TI graphing calculator can be quite easy. High schoolers observe the properties of transformation of functions and create a formula for the transformation.
Curated OER
Exploring Transformations
Young scholars investigate functions and their transformations. They move absolute value functions around on the coordinate plane, and then define the transformation and plot the new graph. The table feature of the TI-calculator is used...
Curated OER
Cell Phone Range
Here is a 15 minute activity that can be used as review, a warm, or as a quick example of how to relate functions to the real world. Learners complete an application activity and draw conclusion about functions then discuss open and...
Curated OER
Creating Parallel Lines and Transversals
Have your class create parallel lines. Students will learn how to identify the different angles created by a parallel line cut by a transversal. Then, they identify and name similar and different angles.
Curated OER
Pythagorean Triples
Teach how to solve problems with right triangles. Students use the Pythagorean Theorem to identify missing sides and angles. Then, they will define and use the Pythagorean Triples to solve problems.
Curated OER
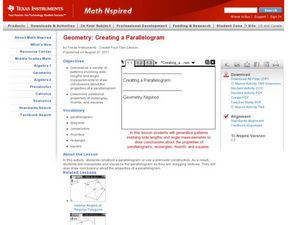
Creating Parallelogram
Learning how to define vocabulary words related to solving parallelograms will assist your learners in identifying different parallelograms. They use the navigator to view different shapes created by moving the parallelogram around.
Curated OER
Exploring Diameter and Circumference
Learn how to identify the diameter and circumference of a circle. Then, collect data on a circle and relate it to the diameter and circumference of a circle. Last, plot data and find the line of best fit.
Curated OER
Tessellations with Regular Polygons
Show your learners how to create tessellations using different polygons. This is achieved by having high schoolers make observations of polygons to find the ones that will tessellate.
Curated OER
Glide Reflections
Perform reflections and transformations by having your students create glide reflections from translated shapes. They use the TiNavigator to explore transformations.
Curated OER
Graphic Designing with Transformed Functions
Teach your class how to transform a graph! By identifying the domain and range of the functions, high schoolers can observe the parabola and find the vertex of the transformed graph.
Curated OER
Properties of Logarithms
Learners investigate properties of logarithmic function as they add, subtract and multiply logarithms. They graph and analyze the graph for exponential equivalency.


