Curated OER
Supply and Demand: Ch 3
Economic supply and demand based on comparative data is the topic of this work packet. Intended for learners in grades twelve or higher, this set of exercises will challenges them to use their data analysis skills in a real-world...
Curated OER
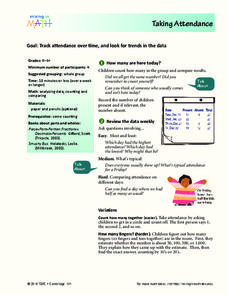
Taking Attendance
Young mathematicians record and analyze data. They will take attendance for their class and compare to other days. Then discuss ways to count who is present. They may also show the amount of students present using fractions.
Statistics Education Web
Now You SeeIt, Now You Don't: Using SeeIt to Compare Stacked Dotplots to Boxplots
How does your data stack up? A hands-on activity asks pupils to collect a set of data by measuring their right-hand reach. Your classes then analyze their data using a free online software program and make conclusions as to the...
Houston Area Calculus Teachers
Collecting Driving Data
Give AP Calculus classes the opportunity to check the accuracy of their calculations! A calculus activity involves the collection of data, the application of mathematics, and the analysis of the accuracy of results. Young mathematicians...
Council for Economic Education
Inflation Data: Is the Economy Healthy?
What stories do current trends tell about society, fashion, and the future? Scholars investigate the concept of inflation and its impact on the future of the American economy. They compile current economic data to determine the level of...
Curated OER
College Athletes
When more basketball players are taller than field hockey players at a school, is it safe to say that in general they are always taller? The activity takes data from two college teams and your learners will be able to answer questions...
Chicago Botanic Garden
Plant Phenology Data Analysis
Studying data over time can paint a pretty interesting picture. Learners use data they collected in the previous instructional activity to compare to historical data in a similar region. They graph the data of the first bloom of a...
Curated OER
Accidents Happen: Seat Belt Laws, Enforcement, and Usage
Start with a NOVA video about car crashes, crash test dummy footage, or other video about seat belt use. Or have groups review attached data about seat belt usage (by state) and share their conclusions. Learners then devise a method to...
Curated OER
Ecosystems and Remote Sensing
Young scholars obtain remote sensing data to compare and contrast global biomass data with global temperature data.
Curated OER
Figure This! Math Challenges for Families
Young mathematicians complete a family math challenge packet. They will complete a packet of mixed math activities. They work with graphs, comparing numerical data, tessellations, and probability.
PBL Pathways
College Costs 2
What is the financial benefit for attending a community college for the first two years before transferring to a four-year college? The second part of the educational lesson asks young scholars to explore this question through data...
Curated OER
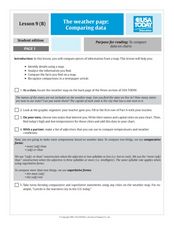
The Weather Page: Comparing Data
Students recognize the different types of data on the weather page of USA Today. For this weather lesson, students compare weather data comparative and superlative forms of adjectives. Students locate 10 pieces of information in the data...
Curated OER
The Weather Page-Comparing Data
Learners examine weather patterns in the United States. In this weather lesson, students use a United States map to identify high and low temperatures in two states. Learners compare the data and record their findings onto a chart.
Curated OER
Exploring Data Sets and Statistics in Baseball
Students explore the concept data sets. In this data sets activity, students find the 5 number summaries for salaries of teachers and compare them with 5 number summaries of professional baseball players. Students use box and whisker...
Curated OER
Comparing Data on Graph A and Graph B
Second graders gather and graph data. In this graphing lesson, 2nd graders collect data and graph this information using tally charts, bar graphs, pictographs, or tables. They make predictions about the outcomes.
EngageNY
Comparing Distributions
Data distributions can be compared in terms of center, variability, and shape. Two exploratory challenges present data in two different displays to compare. The displays of histograms and box plots require different comparisons based...
American Statistical Association
An A-MAZE-ING Comparison
Teach your class how to use descriptive statistics through a hands-on data collection activity. Pupils collect their own data, calculate test statistics, and interpret the results in context. They compare male and female results, looking...
American Statistical Association
Colors Challenge!
Does writing the name of a color in a different colored ink affect one's ability to read it? Scholars design an experiment to answer this question. They collect the data, analyze the statistics, and draw a conclusion based on what they...
Curated OER
Creating Climographs
Students use satellite data to compare precipitation and surface temperatures on different islands. In this satellite lesson students create graphs and explain the differences between weather and climate.
EngageNY
Describing Distributions Using the Mean and MAD
What city has the most consistent temperatures? Pupils use the mean and mean absolute deviation to describe various data sets including the average temperature in several cities. The 10th lesson in the 22-part series asks learners to...
Curated OER
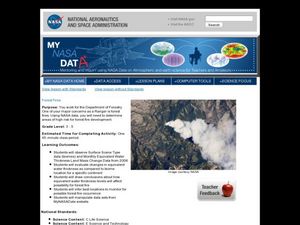
Forest Fires
Students play the role of a Ranger with the Department of Forestry. In this forest fires instructional activity, students examine data on biomes and images to determine high risk areas for forest fires to develop.
Regents Prep
Activity to Show Sample Population and Bias
There is bias in many aspects of our lives, and math is no exception! Learners explore provided data to understand the meaning of biased and random samples. The resource includes various data sets from the same population, and...
American Statistical Association
Don't Spill the Beans!
Become a bean counter. Pupils use a fun activity to design and execute an experiment to determine whether they can grab more beans with their dominant hand or non-dominant hand. They use the class data to create scatter plots and then...
Curated OER
Cold, Clouds, and Snowflakes
Students explore satellite data and graphing. In this weather data analysis math and science lesson, students analyze NASA satellite data to draw conclusions about geographical areas where precipitation might have happened. Students...
Other popular searches
- Compare Related Data Sets
- Compare Data Sets
- Compare Data in Graphs
- Compare and Record Data
- Compare Data Collection
- Compare Data on Graphs


