American Museum of Natural History
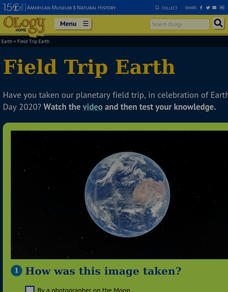
Field Trip Earth
Take a field trip around Earth by way of satellite images. Learners watch a video lesson that describes different images taken from orbiting satellites. They then test their visual skills in a 14-question online quiz.
Las Cumbres Observatory
Star In a Box (Paper-Based)
Do stars age gracefully? Young astronomers use colored paper and data on luminosity and temperature to model the changes of a star during its lifetime. They then compare models of stars of different mass and radii.
Science 4 Inquiry
A Whole New World: The Search for Water
Scholars find Earth won't support humans much longer and need to identify a planet with water to inhabit. They test four unknown samples and determine which is the closest to water. Then they explain and defend their results.
Curated OER
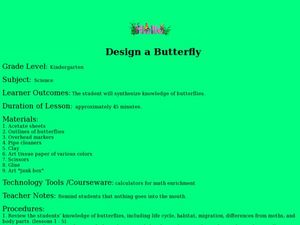
Design a Butterfly
Students access prior knowledge of butterflies. In this butterfly lesson, students create butterflies and compare and contrast their butterflies. Students describe the various body parts.
Curated OER
Endangered Species
Ninth graders graph data in order to compare the number of extinct species and a rise in human population. They analyze the data collected. Students are encouraged to infer the relationship.
Curated OER
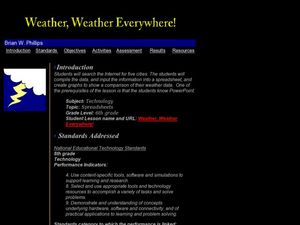
Weather, Weather, Everywhere!
Sixth graders collect weather data to compare temperatures around the world. Using the Internet, learners collect data, put it into spreadsheets, and analyze and graph the results. An interesting way to cover the topic of weather.
Georgia Department of Education
The Basketball Star
Have learners use math to prove they are sports stars! Assess a pupil's ability to create and analyze data using a variety of graphs. The class will be motivated by the association of math and basketball data.
Curated OER
Height and Weight
Third graders explore their height and weight. They measure the heights and weights of their peers. Students record their data using an Excel spreadsheet. They create a graph to compare the data and analyze it for a correlation between...
Curated OER
Heartbeat Project
Students enter information about their heartbeats into a spreadsheet. They construct data displays and calculate statistics. They describe and justify their conclusions from the data collected.
Illustrative Mathematics
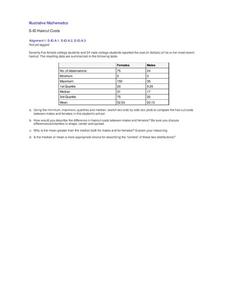
Haircut Costs
Who pays more for haircuts, men or women? Given quartile values, learners construct box and whiskers plots and interpret the results. They compare the mean and median, and discuss which is more appropriate under particular conditions....
Illustrative Mathematics
Speed Trap
In which direction is traffic moving faster, north or south? Use box and whisker plots to organize data and interpret the results. Detailed solutions are included. This activity would be good as a warm up or quick assessment at the end...
Curated OER
Exponential Models
Students fit a continuous change exponential model to U.S. population data and use the model to predict future population.
Curated OER
Elementary Statistics in Life
Students examine newspapers for graphs. They collect and sort data that is of interest to them. They enter data into a database and make comparisons using the information.
Curated OER
Acid-base Indicators
There is a chart to complete with results of the titrations for the 14 different pH indicators. There are also nine questions for data analysis, and then four problems requiring equations, molarities, and pH values.
Curated OER
Application and Modeling of Standard Deviation
The first activity in this resource has learners computing the mean and standard deviation of two different data sets and drawing conclusions based on their results. The second activity has them using a dice-rolling simulation to...
Curated OER
Size It Up: Map Skills
Compare information from a US population cartogram and a standard US map. Learners draw conclusions about population density by analyzing census data a population distribution. They discover that census data is used to apportion seats in...
Curated OER
Mean and Standard Deviation
Get two activities with one lesson plan. The first lesson plan, is appropriate for grades 6-12 and takes about 20 minutes. It introduces the concept of measures of central tendency, primarily the mean, and discusses its uses as well as...
Curated OER
Exploring Muscle Action in the Human Body
Learners collect and graph data and use the internet to research the skeletal muscles.
Curated OER
Minority Graduation Rates: A 50-50 Chance
Pupils read the Civil Rights Project report. Students collect data from graduation rates in their school/district or city. Pupils compare state and local data. Students discuss and analyze minority graduation rates. Pupils compare local...
Curated OER
Minority Graduation Rates: A 50-50 Chance
Students conduct research on issues and interests by generating ideas and questions and by posing problems. They gather, evaluate and synthesize data from a variety of sources. In this lesson the issue is minority graduation rates.
Curated OER
Unit 2: Lesson 8
Students login to their account and access information from keypals. They compare their data with information recieved by classmates. Students review question that were asked of keypals. They discuss ways that expected data can be...
Curated OER
Get Ready For Some Football
Sixth graders compare and contrast the totals from two national football teams for the year. Using the internet, they search for the information they need and create a data bar graph. They use the information they collected to answer...
Curated OER
How's The Weather?
Students make a box and whiskers plot using the TI-73 graphing calculator. Each student would have their own calculator but they would work in small groups of two or three to help each other enter the data and make the plots.
Curated OER
Mean Absolute Deviation in Dot Plots
The lesson focuses on the ideas of dot plot representations and the mean absolute deviation of data sets.
Other popular searches
- Compare Related Data Sets
- Compare Data Sets
- Compare Data in Graphs
- Compare and Record Data
- Compare Data Collection
- Compare Data on Graphs


