Curated OER
Mean Absolute Deviation in Dot Plots
The lesson focuses on the ideas of dot plot representations and the mean absolute deviation of data sets.
Curated OER
Living With the Weather
Mini-meteorologists visit the National Climate Data Center online to gather past weather information for the area that they live in. They consider how the weather patterns may have influenced the architecture of the area. Finally, they...
Curated OER
Weather Pals
Students study maps of the United States to locate weather pals from a list of schools. They communicate with Weather Pal schools through the use of closed circuit TV. Using weather data collected in their area, they exchange the...
Curated OER
Patterns Here, There and Everywhere
Pattern recognition is a skill often used in mathematics. Learners count and sort manipulatives, organize the data into a graph and answer questions about the information displayed. They collect the objects to be used and create patterns...
Curated OER
Probability: The Study of Chance
Students conduct an experiment, determine if a game is fair, and collect data. They interpret data, then display line graph. They conduct analysis of game for probability.
Curated OER
Sundials and Shadows - What Can They Teach Us About Seasons?
Learners collect and analyze data relating to seasonal changes. They view a video, research web sites and build a sundial to collect their data.
Curated OER
MAISA and the REMC Association of Michigan
Students complete online research to study geography's impact on weather. In this geography and weather lesson plan, students research weather in their city for ten days using an online website. Students bookmark the site, enter data...
Curated OER
Linear Modelling of the Life Expectancy of Canadians
Middle and high schoolers explore the concept of linear modelling. In this linear modelling lesson, pupils find the line of best fit for life expectancy data of Canadians. They compare life expectancies of men and women, and find the...
Curated OER
Are Our Chemical Measurements Accurate or Precise?
What is the difference between accuracy and precision? This worksheet has students define the terms accuracy and precision, and compare bulleye diagrams to find examples of both. Students analyze given data and determine the accuracy and...
Curated OER
The Coriolis Effect
Students will determine the direction of Earth's rotation as viewed from the north and south if they were suspended out in space. They will model how the rotation of the Earth causes currents to be deflected in different directions for...
Curated OER
Bugs, Bugs, Everywhere!
Students collect and compare bugs using magnifying lenses and graph data based on their comparisons. In this bugs lesson plan, students also make an aspirator by using a jar, tubing, and screen.
Curated OER
Making Sense of the Census
Students problem solve the mean and median of agricultural data by completing a worksheet. They discuss the results of the statistical data.
Curated OER
Graphing the Facts
Middle schoolers investigate the correlation between our planet's weather and solar activity. They analyze and discuss data regarding the solar activity cycle, graph annual precipitation and temperature averages over a period of 100...
Curated OER
How Big Is Your Head?
Students explore measurement by measuring classmates' heads. They record their measurements and they put the measurements in order from smallest to largest. Students figure the mean, median, mode, maximum, minimum, and range of their...
Curated OER
The Hispanic Migration into Iowa
Sixth graders examine the positive and negative effects of the migration of people of Hispanic descent in the state of Iowa. They examine and interpret census data using maps before comparing the positives and negatives. They read...
Curated OER
Alfalfa Butterfly/Caterpillar Lifecycle Investigation
Young scholars collect and record data. They identify sex of butterflies. They make conclusions based on collected data.
Curated OER
Drawing One and Two Playing Cards With Replacement
Math whizzes use data from simulations to make theoretical generalizations and discuss possible relationships between several given events. They use a simple card game to generate data to be analyzed.
Curated OER
Measuring the Number Of Calories In Sunlight
Students., in groups, define calorie and compare the absorption of solar energy by three different collectors. They define solar constant and offer several explanations for discrepancies between the data collected and the solar constant.
Curated OER
Feeding in the Flow
The National Oceanic and Atmospheric Administration (NOAA) has developed a tremendous library of ocean-themed lessons that can be used in a variety of science settings. "Feeding in the Flow" is one of those activities; Its focus is on...
Curated OER
How Does Your (Coral) Garden Grow?
Analyze and graph oxygen isotope ratios in coral samples in relation to the distance from the outer skeleton edge. Compare the data to the mean monthly water temperatures. Uncover whether or not there is any correlation. In addition to...
Curated OER
Estimation & Central Tendency
Eighth graders view pictures that show many objects, estimate amount that they think they saw, and take class data from estimation to find the mean, median, mode, and range for the class.
Curated OER
Whoa! Slow Down-Some of You!
Students analyze demographic data (growth rate, natural increase, fertility rate, crude birth rates, and crude death rates) and determine which areas of the world contain the fastest and slowest growth rates. They construct population...
Curated OER
How Times Have Changed
Fifth graders work in small groups to compile job changes. They use data from the list of changes that the group generated together. Students analyze the data to determine: categories of changes, patterns or trends of changes, and future...
Alabama Learning Exchange
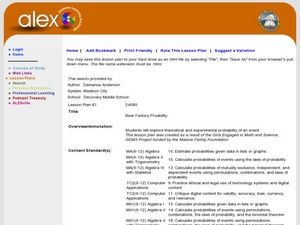
Bear Factory Probability
By examining a set of dice roll data, statisticians determine the probability of different sums occurring. They visit an interactive website and determine how many different vacation outfits Bobbie Bear will have based on the colored...
Other popular searches
- Compare Related Data Sets
- Compare Data Sets
- Compare Data in Graphs
- Compare and Record Data
- Compare Data Collection
- Compare Data on Graphs


