Curated OER
Outbreak!
Eleventh graders explore the spread of a disease through a population. In this Algebra II lesson, 11th graders analyze graphical data representing they spread of a disease. Students produce a graph of the virus data, analyze the data,...
Curated OER
Pumpkin Seed Experiment
For this unique lesson pupils participate in a pumpkin seed experiment. Students interact with the pumpkins weight, seeds and record their findings of what lies within the pumpkin once the top of the pumpkin is cut off for observations....
Curated OER
Ocean Waves and Tides
In this tides activity, students will use a tide chart to plot 15 data points onto a graph. Students will be looking at high tides and low tides and comparing the ranges. This activity has 2 short answer questions.
Curated OER
Hlf-Ball
Students investigate Newton's Laws of Motion and the Law of Conservation of Energy. They examine how a ball and half-ball behave and relate these laws to what happens to the ball. Students produce a graph of the data collected and...
Curated OER
Comparison of Snow Cover on Different Continents
Students use the Live Access Server (LAS) to form maps and a numerical text file of snow cover for each continent on a particular date. They analyze the data for each map and corresponding text file to determine an estimate of snow cover...
Curated OER
Atlatl Lessons Grade 4-12
Students experiment with velocity, ratios, and rates. In this data management lesson plan, students throw a dart with and without using an atlatl and collect and record various data. Students construct ratios based on the data and...
Curated OER
Weather or Not
Sixth graders explore weather. In this meteorology lesson, 6th graders create weather instruments and compare and contrast weather data.
Curated OER
How Do I Measure Up?
Students measure and record weights and heights and compare to others in the class as they find out more about their bodies.
Curated OER
Color Me Hot
Seventh graders use the scientific method, to observe, record and analyze the data they gathered. They make observations using their five senses. Students compare, contrast and draw conclusions based on the observations and data...
Curated OER
CSI Clamshell Investigation
Pupils explore and explain how moon snails eat and where the holes in clamshells come from and then draw conclusion from the data collected. They incorporate math and graphing skills to determine if there is a relationship to a clam's...
Curated OER
Solar Kit Lesson #7 Positioning Solar Panels I: Explorations with Tracking
Students track and record data on the Sun's position in the sky and on the output of a solar panel tracking the Sun. On a second day, students graph and analyze the data to identify relationships between (1) the time of day, (2) the...
Curated OER
Amazing Bean Races
Students experiment with bean growth in varied conditions. In this plant biology lesson, students plant beans in soil and in spun cellulose (absorbent material in diapers) and measure the growth of their seedlings. They collect the data...
Curated OER
Primary Biological Content Area Covered
Learners use the scientific method to make predictions about mold growth. In this fungus lesson, students use worksheets to help them illustrate predictions and graph mold growth from white to wheat bread. Learners first...
Curated OER
Magnetic Polls
Students explore the New Hampshire primaries and the polling process by analyzing polling information, examining the effects of polls, and creating graphs that represent polling data.
Curated OER
Traveling with Flat Stanley
students use the internet to gather geographical data about a state of their choice. Using new vocabulary, they describe the features present in the state, its climate and attractions. They develop a PowerPoint presentation to share...
Curated OER
Finding Caterpillars
Students examine how animals protect themselves from predators and camouflage themselves. They participate in a simulation in which they locate red and green yarn "caterpillars," organize their data, and generate a bar graph using...
Curated OER
Annotated Example of Socratic Questioning: Climate: Global Warming
Students compare and discuss short-term and longer-term global temperature data. They evaluate data from three sets of graphs and then participate in a structured whole class Socratic discussion on the possible causes of climate change.
Curated OER
Atlatl Lessons for Grade 8
Eighth graders explore the weapons of the Aboriginal people. In this eight grade math/science lesson, 8th graders collect and analyze data regarding the speed and distance of a dart thrown with an atlatl. Students choose the...
Curated OER
Fast Food: You Can Choose!
Young scholars research the nutritional value of fast food. They assess which fast foods are best and worst to eat. They organize their data into tables and graphs and explain their findings to other students.
Curated OER
Unit VII: Energy: Worksheet 2 Hooke's Law
Physic starters spring into energy with a problem-solving activity. They work with graphs, apply Hooke's law, draw force diagrams, and solve for distance, force, or mass in spring systems. There are seven problems in all.
02 x 02 Worksheets
Inverse Variation
Discover an inverse variation pattern. A simple lesson plan design allows learners to explore a nonlinear pattern. Scholars analyze a distance, speed, and time relationship through tables and graphs. Eventually, they write an equation to...
Curated OER
Flowers, Pods, and Seeds
Students gain an understanding of living organisms. the complete a plant growth data log to chart plant growth and to make observations, predictions, and personal reflections.
Curated OER
Fuel Mystery Dis-Solved
Pupils describe how temperature and surface area exposure affect the rate at which fuel is consumed. They explain why engineers want to know about the properties of a fuel when designing rockets. They create a bar graph of result data.
Curated OER
Dinosaur Mathematics
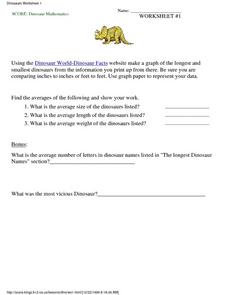
In this science and math worksheet, 5th graders answer four different questions related to dinosaurs. They graph the information with data located at a given website.


