Mathalicious
On Your Mark
With many factors leading to a great athlete, does height make Usain Bolt unfairly fast? Middle schoolers conduct analysis to change the running distance of the Olympic races to be proportional to the height of the participants. They...
Texas Instruments
Is It or Isn't It Proportional
How can you tell if number relationships are proportional? Mathematicians investigate proportional relationships. They compare and contrast functions and graphs to determine the characteristics of proportional relationships, as well as...
Willow Tree
Ratios and Proportions with Congruent and Similar Polygons
Investigate how similar and congruent figures compare. Learners understand congruent figures have congruent sides and angles, but similar figures only have congruent angles — their sides are proportional. After learning the...
Illustrative Mathematics
Walk-a-thon 1
Your mathematician's job is to explore the relationship between hours and miles walked during a walk-a-thon. The activity compels your learners to experiment with different means in finding out this proportional relationship. The answer...
EngageNY
Linear Functions and Proportionality
Connect linear equations, proportionality, and constant rates of change to linear functions. Young mathematicians learn how linear equations of the form y = mx + b can represent linear functions. They then explore examples of linear...
EngageNY
Constant Rate
Two-variable equations can express a constant rate situation. The instructional activity presents several constant rate problems. Pupils use the stated constant rate to create a linear equation, find values in a table, and graph the...
EngageNY
Constant Rates Revisited
Find the faster rate. The resource tasks the class to compare proportional relationships represented in different ways. Pupils find the slope of the proportional relationships to determine the constant rates. They then analyze the rates...
EngageNY
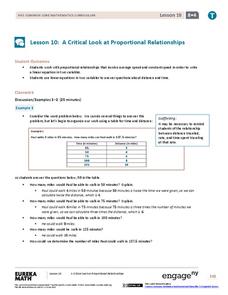
A Critical Look at Proportional Relationships
Use proportions to determine the travel distance in a given amount of time. The 10th installment in a series of 33 uses tables and descriptions to determine a person's constant speed. Using the constant speed, pupils write a linear...
Curated OER
Dragonfly
The speed of a dragonfly brings math into the real world as your learners collaboratively see the value in calculating unit rates in direct proportion problems. This six-phase lesson plan encourages you, as the teacher, to only ask...
Howard County Schools
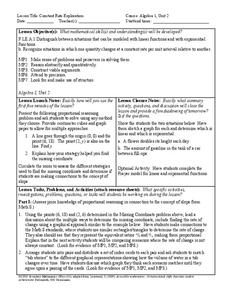
Constant Rate Exploration
Question: What do rectangles and bathtub volume have in common? Answer: Linear equations. Learn how to identify situations that have constant rates by examining two different situations, one proportional and one not proportional.
Curated OER
Proportionality, Ratios and Constant Variation
Students use Scion Image to estimate the proportion of space images. In this proportion lesson, students investigate the online site of Image of the Orbitor and relate the dimensions and sizes to known sizes.
EngageNY
Tax, Commissions, Fees, and Other Real-World Percent Problems
Pupils work several real-world problems that use percents in the 11th portion of a 20-part series. The problems contain percents involved with taxes, commissions, discounts, tips, fees, and interest. Scholars use the equations formed for...
Mathematics TEKS Toolkit
Am I Related to Myself?
Elementary or middle schoolers use ratios to discover some nearly constant relationships between measurements of parts of the human body. They find and record pairs of measurements and determine the relationship between the pairs. Pupils...
Illustrative Mathematics
Running at a Constant Speed
The learner must use the given constant speed to find the unit rate. A table is made in order to relate the speed to the time and the distance. From the table, learners are able to see the unit rate in miles per minute and miles per...
Curated OER
60-30-10
Students use ratios and proportions to represent quantitative relationships as they investigate the concept of how percentages are used by designers. Students decorate the same room using three different percentages of colors.
Illustrative Mathematics
Walk-a-thon 2
During a walk-a-thon your learners must determine the walking rate of Julianna's progress. Using tables, graphs, and an equation, they must be able to calculate the time it took her to walk one mile and predict her distance based on the...
NASA
Exercising in Space
Using the CEVIS space bike as a context, groups work together to calculate the settings required for astronauts to reach their necessary exercise. Pupils calculate the prescribed exercise settings and complete the last section, which can...
EngageNY
Population Problems
Find the percent of the population that meets the criteria. The 17th segment of a 20-part unit presents problems that involve percents of a population. Pupils use tape diagrams to create equations to find the percents of subgroups of the...
Curated OER
Similarity
Students find the factor of proportionality in similar polygons. For this similarity of polygons lesson plan, students measure the sides and angles of polygons and derive a factor of proportionality between corresponding pairs of sides...
Curated OER
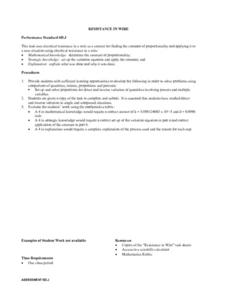
Resistance in a Wire
High schoolers find the constant of proportionality and apply it to a situation. They use the electrical resistance in a wire as a context for finding the constant of proportionality. In addition, they write an explanation and...
Illustrative Mathematics
Robot Races
Analyze data on a graph to answer three questions after a robot race. Learners practice comparing ratios and reading points on a graph. Answers may vary on the last question based on accuracy of graphing. Use the lesson along with three...
Illustrative Mathematics
Friends Meeting on Bikes
It is the job of your mathematicians to figure out how fast Anya is riding her bike when meeting her friend. The problem shares the distance, time spent riding, and Taylor's speed leaving the last variable for your learners to solve. Use...
EngageNY
Ratios of Fractions and Their Unit Rates 2
Remodeling projects require more than just a good design — they involve complex fractions, too. To determine whether a tiling project will fit within a given budget pupils calculate the square footage to determine the number of tiles...
EngageNY
An Exercise in Creating a Scale Drawing
Design your dream classroom. The lesson plan contains an exercise to have teams create a scale drawing of their dream classroom. Pairs take the measurements of their classroom and furniture and create a scale factor for them. To finish...


