Curated OER
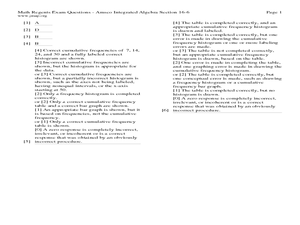
Quartiles, Percentiles, and Cumulative Frequency
In this statistics lesson, 11th graders are asked to calculate the percentiles, quartiles and cumulative frequency given different graphs and data. There are 6 questions with an answer key.
Curated OER
Which Amusement Park Would You Choose?
Young scholars analyze data related to amusement parks and create a spreadsheet to display the data. They read the data and predict which amusement park they think is safer, create a spreadsheet and graph, and write a proposal based on...
Curated OER
Graph it!
Sixth graders view a Stacked Graph, and discuss what it shows. Students discuss the basics of graphing: labels, intervals, legends x and y axis... Students create individual stacked graphs from provided information. Students view a...
Curated OER
Venn Diagram and UK Basketball
Students analyze data and make inferences. In this algebra activity, students collect and analyze data as they apply it to the real world.
Curated OER
Infusing Equity Gender into the Classroom
Students investigate if gender makes a difference in the classroom. For this statistics lesson, students collect data on whether equity by gender in the classroom makes students more successful.
Curated OER
BEETLES: The Coming Out
Students design an experiment to test the variables involved in the hatching of the Bruchid beetle.
Curated OER
Schoolyard Bird Project
Students observe and count bird sightings around their schoolyard throughout the school year.
Curated OER
Analyzing Graphs and Data
Students collect and analyze data. In this statistics lesson, students graph their data and make inferences from the collected data. They display their data using graphs, bar graphs, circles graphs and Venn diagrams.
Curated OER
Statistical Analysis of Data by Gender
Students examine and identify gender bias, stereotyping, and discrimination in school materials, activities, and classroom instruction. They apply descriptive statistics knowledge to real-world data.
Curated OER
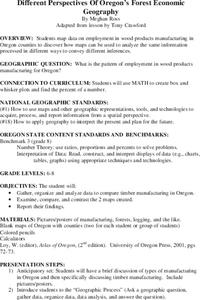
Different Perspectives of Oregon's Forest Economic Geography
Students locate the many forests located in Oregon. In groups, they use the internet to research employment data on wood products made in the state. They discuss how looking at information presented in a different way can change their...
Curated OER
Histograms and Frequency Tables
In this statistics worksheet, students solve and analyze graphs. They use histograms and frequency tables to solve their problems. There are 2 multiple choice questions with an answer key.
Curated OER
Environmental Mathematics
Eighth graders determine food that they would need to survive in the wild. They graph the best foods for their environments and rate the survivability rate for each member of their group.


