Curated OER
The Hot Dog Stand - An Annual Report
Students run a computer simulation and collect data as they work and use the data to create an annual report for their business. It is desirable for students to do this project individually, but it could be done as a class using a large...
Curated OER
Graphs and Functions
Use this series of activities to introduce learners to graphing functions. They graph both linear and quadratic equations by hand and with a Graph Sketcher Tool. Several imbedded links and handouts are included in the instructional...
Curated OER
Which Amusement Park Would You Choose?
Young scholars analyze data related to amusement parks and create a spreadsheet to display the data. They read the data and predict which amusement park they think is safer, create a spreadsheet and graph, and write a proposal based on...
Curated OER
Density of Pennies Lab
In this density of pennies worksheet, student conduct an experiment to determine the metals used in the core of pennies made after 1983. Learners design their own experiments using a balance and graph paper to determine the density of...
Curated OER
Which Car Should I Buy?
Students use gas mileage of different cars to create T charts, algebraic equations, and graphs to show which gets better mileage. For this gas mileage lesson plan, students use the graph to see which car they should buy.
Curated OER
Battlefield Walks
Learners create a picture of a Civil War battle using Google Earth. In this Civil War lesson, students pick a battlefield and research it with a partner. They find the location on Google Earth and use colors and overlays to show...
Curated OER
Relations and Functions
Students differentiate between a relation and a function. In this algebra instructional activity, students identify a pair of coordinates as being a relation or a function. They analyze graphs for function as they solve word problems.
Pennsylvania Department of Education
Using the Coordinate Plane in Problem Solving
Fifth graders practice solving problems. In this fraction and decimal lesson plan, 5th graders recognize the relationship between fraction and decimals. Students estimate problem results and write expressions to use for problem solving.
Curated OER
Shadow Puppets
Students examine the role of shadow puppets. They create their own puppet and put on a play.
Curated OER
Exploring The Depths!
Fifth graders make a model of the ocean floor. In this ocean characteristics instructional activity, 5th graders complete a KWL chart about the ocean floor, use the Ocean Depth Data Sheet to create a graph, and create a 3-D model of the...
Curated OER
Book Illustration
Students view a video and discuss what illustrations in a book show and don't show. In this observation lesson, students look at the details on a page in Alice in Wonderland and create an illustration.
Curated OER
Snow Cover By Latitude
Students examine computerized data maps in order to create graphs of the amount of snowfall found at certain latitudes by date. Then they compare the graphs and the data they represent. Students present an analysis of the graphs.
Curated OER
A Bird's Eye View of our 50 States
Third graders focus on state birds as they learned absolute location (latitude/longitude) of each state, as well as their relative location (bordering states).
Curated OER
Home on the Biome
Fifth graders study six major biomes, graph temperature and rainfall, and present their findings to the class.
Curated OER
Science: Hurricanes As Heat Engines
Young scholars conduct Internet research to track the path of Hurricane Rita. They record the sea surface temperature of the Gulf of Mexico during and after the hurricane and draw conclusions about how hurricanes extract heat energy...
Curated OER
What is a Cloud
Third graders study clouds and how they are formed. They write acrostic poems about clouds and analyze and graph temperature data collected during varying degrees of cloud cover.
Curated OER
Destination of Slaves in 1800
In this slave trade worksheet, learners use the provided Atlantic Slave Trade statistics to create a pie chart and a bar graph. Students also respond to 4 short answer questions.
Curated OER
Scurvy at Sea: Researching and Writing About Vitamin C Deficiency
Students gather information about vitamin C deficiency, and research how scurvy was prevented in sea-going ventures during The Age of Sail. They create a "Scurvy Log" that will allow them to connect what they have learned about scurvy...
Curated OER
Fly on the Ceiling
Fourth graders play variety of games to help them explain coordinates.
Curated OER
Spaghetti Bridges
Students thread a piece of spaghetti through the holes in the cup. One person suspend the cup by placing each index finger approximately one inch in from the ends of the spaghetti.
Curated OER
Spaghetti Bridges
Eighth graders experiment with building bridges of spaghetti, pennies, and a cup to determine how varying the number of spagetti pieces affects the strength of the bridge. They graph their results and interpret the data.
Curated OER
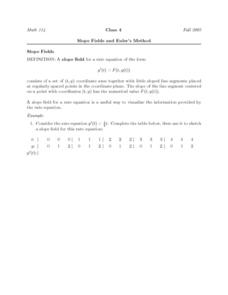
Slope Fields and Euler's Method
For this slope field worksheet, students use a slope field for a rate equation. Using Euler's Method, they identify the piecewise linear function approximating the solution of the initial value problem. This four-page worksheet...
Curated OER
Electric Field Mapping in 3D
Students create a 3D vector field map of an electric field. For this physics lesson, students measure the voltage inside an aquarium with water. They present their findings and map to class..
Curated OER
Cloud Observation and Graphing
Students identify the three major cloud groups. They are introduced to the three main cloud types and spend a week making and recording observations of clouds. Students produce a graph that presents their findings and conduct research...


