EngageNY
From Ratio Tables, Equations and Double Number Line Diagrams to Plots on the Coordinate Plane
Represent ratios using a variety of methods. Classmates combine the representations of ratios previously learned with the coordinate plane. Using ratio tables, equations, double number lines, and ordered pairs to represent...
Curated OER
Scatterplots and Regressions
In this scatterplots and regressions activity, students solve 6 different types of problems related to graphing scatterplots and interpreting regressions. First, they create a scatterplot from the given data coordinates and then,...
Curated OER
When Ants Fly
Here is a great lesson on constructing line graphs. Learners identify common characteristics of birds, ants common needs of all living things. They also write a story from the perspective of an ant or a bird that has lost its home and...
Virginia Department of Education
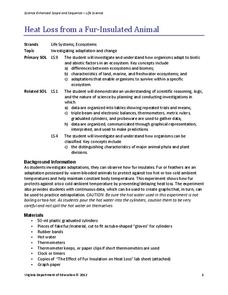
Heat Loss from a Fur-Insulated Animal
How do animals adapt to weather changes? Provide your class with the ability to understand adaptations and body temperature as they participate in this hands on experiment, using fake fur and hot water. Pupils collect data and analyze...
Curated OER
Graphs involving Exponential Functions
In this algebra worksheet, learners graph exponential functions and analyze it for growth and decay. There are 9 problems with an answer key.
It's About Time
Mass Extinction and Fossil Records
The focus of a fossil-based lesson uses graphs and charts that allow young paleontologists to make inferences about events of mass extinction. They must apply their previous knowledge about fossil records in this final lesson of the...
Curated OER
Graphing Quadratic Equations
Review the form of a quadratic function, and the parabola it creates. Continue on with the whole group to work through a mini-lab, practicing how to graph quadratic equations with one variable. The goal of this lesson is for the group...
Curated OER
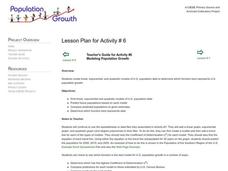
Modeling Population Growth
Learners create linear, exponential, and quadratic models of U.S. population data to determine which function best represents U.S. population growth. They predict future populations based on each model.
Curated OER
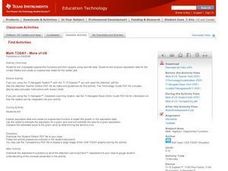
More of U.S.
Explore graphical representation of a real-life data set and determine the exponential regression model for the data in your classroom. Students also compare the estimated value to the given value by determining the percent error.
Curated OER
Making Connections
Seventh graders relate patterns with higher math. In this 7th grade math lesson, 7th graders analyze different methods of portraying data. They relate the data to real life scenarios.
Inside Mathematics
Quadratic (2009)
Functions require an input in order to get an output, which explains why the answer always has at least two parts. After only three multi-part questions, the teacher can analyze pupils' strengths and weaknesses when it comes to quadratic...
Virginia Department of Education
Linear Modeling
An inquiry-based algebra lesson explores real-world applications of linear functions. Scholars investigate four different situations that can be modeled by linear functions, identifying the rate of change, as well as the strength and...
Curated OER
Graphing Linear Equations
Ninth graders review the information that they have already learned
with regard to linear equations and graphical representations. They then assist in combining equations with a graphical element and complete various graphs with this...
Curated OER
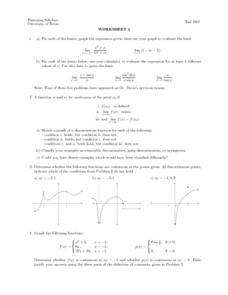
Worksheet 4: Limits
In this limits worksheet, students evaluate limits and graph given expressions. They classify graphs as removable discontinuities, jump discontinuities, or asymptotes. this two-page worksheet contains seven multi-step problems.
Curated OER
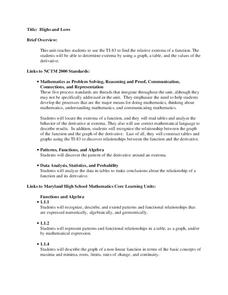
Highs and Lows
Solve problems using integration and derivatives. By using calculus, learners will analyze graphs to find the extrema and change in behavior. They then will identify the end behavior using the derivatives. Activities and handouts are...
Curated OER
Investigation - Looking For Triangles
Seventh graders investigate a series of triangles, looking for patterns and generalizing what they have found. They analyze the pattern data and organize it into a table and graph. Students identify the relationship and discover the rule...
Curated OER
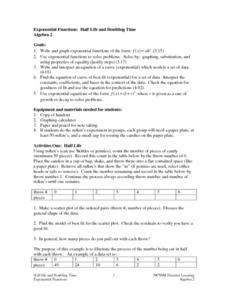
Exponential Functions: Half Life and Doubling Time
High schoolers investigate the concept of exponential functions and how they increase in size over time. They simplify the functions in order to find the solutions that are possible and perform analysis of the curved line that is...
Curated OER
Round and Round and Round We Go!
Students investigate motion using a CBL. In this algebra lesson, students collect and graph data on a coordinate plane. They define and identify amplitude and period of conic graphs.
Curated OER
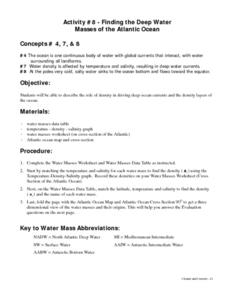
Finding the Deep Water Masses of the Atlantic Ocean
Students describe the role of density in driving deep ocean currents and the density layers of the ocean. They determine that the ocean is one continuous body of water with global currents that interact, with water surrounding all...
Curated OER
Carbon Dioxide Increases
In this atmospheric carbon dioxide worksheet, students use a graph of the Keeling Curve showing the increase in atmospheric carbon dioxide since 1958 to solve 6 problems. They determine the rate of increase, the find the percentage of...
Curated OER
Butterfly Addition: Color by Numbers
Children learning to add numbers up to 11 develop the strategy of using the larger number as the first addend and counting on from there to find a sum. They define addition and review the meaning of the plus (+) symbol. To practice, they...
Curated OER
Perimeter Pattern
High schoolers investigate perimeter patterns formed by a hexagon and a triangle. They will identify the dependent and independent variable and write a function for the relationship.
Curated OER
Get a Half-life!
Students use m&m candies as their sample set. They begin by counting the total number of candies to determine their sample size. Students put the candies into a cup and shake them gently before pouring them onto a paper plate. Count...
Curated OER
Solar Kit Lesson #7 Positioning Solar Panels I: Explorations with Tracking
Students track and record data on the Sun's position in the sky and on the output of a solar panel tracking the Sun. On a second day, students graph and analyze the data to identify relationships between (1) the time of day, (2) the...


