Balanced Assessment
Garages and Phones
Examine and compare a linear and step function. The task provides two scenarios, one modeled by a linear function and the other a step function. Pupils create a graph for each and explain how each compares to the other.
CK-12 Foundation
Evaluate Limits Using Graphs and Tables: Where Is That Limit?
Limits are made easy through graphs and tables. An easy-to-use interactive lets users change a function on a coordinate plane. They relate graphs and tables to the limit at a specific value.
CK-12 Foundation
Evaluate Limits Using Graphs and Tables: Evaluate the Limits
Discontinuities in the graph? No worries. Pupils investigate the limit of a function given graphically using an interactive. The graph has removable and jump discontinuities.
Mathematics Assessment Project
Shelves
Don't leave this task on the shelf — use it is assess middle schoolers understanding of patterns. Participants try to discover a pattern in the number of bricks and planks used to make shelves. They then match descriptions and equations...
Curated OER
Continuity
Students examine graphs to determine if they are continuous at a given point. In this examining graphs to determine if they are continuous at a given point lesson, students examine various graphs. Students determine points on the graph...
West Contra Costa Unified School District
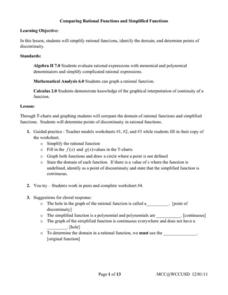
Comparing Rational Functions and Simplified Functions
What kind of functions have holes in their graphs? Here, the teacher guides the class on how to use the simplified function of a rational function to aid in the graphing of the original rational function. T-tables are used in order to...
Virginia Department of Education
Functions: Domain, Range, End Behavior, Increasing or Decreasing
Examine key features of various functions through exploration. A comprehensive lesson has learners describe the domain, range, end behavior and increasing/decreasing intervals of various functions. Function types include linear,...
Mathematics Vision Project
Module 4: Rational Functions
Time to study the most sensible function — rational functions! The seven-lesson unit develops the concept of a rational function through a connection to rational numbers and fractions. Scholars graph functions, solve equations, and...
Willow Tree
Line Graphs
Some data just doesn't follow a straight path. Learners use line graphs to represent data that changes over time. They use the graphs to analyze the data and make conclusions.
Curated OER
Intersecting Graphs
Ninth graders know how to solve a system of linear equations, but what happens when the system involves an exponential function? The instructional slideshow teaches viewers to determine solutions to systems of equations with linear and...
EngageNY
Increasing and Decreasing Functions 2
Explore linear and nonlinear models to help your class build their function skills. In a continuation of the previous lesson, learners continue to analyze and sketch functions that model real-world situations. They progress from linear...
EngageNY
Why Stay with Whole Numbers?
Domain can be a tricky topic, especially when you relate it to context, but here is a lesson that provides concrete examples of discrete situations and those that are continuous. It also addresses where the input values should begin and...
CK-12 Foundation
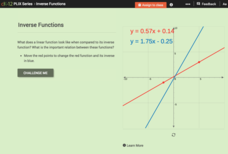
Inverse Functions
Provide a graphical view of inverses. Pupils manipulate points on a line and see the relationship of the graph with the graph of its inverse. Using the relationship between the graphs, scholars respond to questions concerning inverses...
CK-12 Foundation
Horizontal and Vertical Asymptotes: Rational Functions
Play with the graph of a rational function to discover the asymptote patterns. Young scholars use the interactive lesson to discover the relationship between the asymptotes and the function. As they manipulate the function, the graph...
Charleston School District
Increasing, Decreasing, Max, and Min
Roller coaster cars traveling along a graph create quite a story! The lesson analyzes both linear and non-linear graphs. Learners determine the intervals that a graph is increasing and/or decreasing and to locate maximum and/or minimum...
CK-12 Foundation
Derivatives of Trigonometric Functions: Derivative of sin(x)
Graphically find the derivative of sin(x). Using the interactive, pupils graph the slope of the tangent line to the sine function. Class members use the resulting graph to determine the derivative of the sine function. They verify their...
EngageNY
Properties of Trigonometric Functions
Given a value of one trigonometric function, it is easy to determine others. Learners use the periodicity of trigonometric functions to develop properties. After studying the graphs of sine, cosine, and tangent, the lesson connects them...
CK-12 Foundation
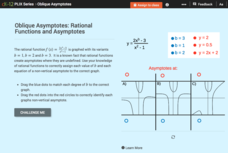
Oblique Asymptotes: Rational Functions and Asymptotes
Examine the connection between rational functions and their graphs. Individuals use an online manipulative to sort equations with horizontal and oblique asymptotes. They focus on the degree of the numerator and denominator.
CK-12 Foundation
Algebraic Functions: Vertical Line Test
To be (a function) or not to be (a function). An easy-to-use interactive has pupils drag a vertical line onto several graphs to determine if they represent functions. Some challenge questions assess understanding of this idea.
CK-12 Foundation
Infinite Limit Type: Evaluating Limits of Rational Functions
Rational functions become less mysterious when you know about limits. Individuals use an interactive to move a rational function on a coordinate plane and to investigate function values for certain x-values. They see how the limit...
CK-12 Foundation
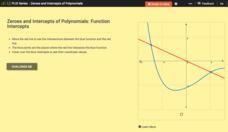
Zeroes and Intercepts of Polynomials: Function Intercepts
There is zero reason not to use the resource. Given a graph with a polynomial function and a linear function, scholars move the line in an interactive. To wrap up the lesson, they note how zeros and intersection points change.
CK-12 Foundation
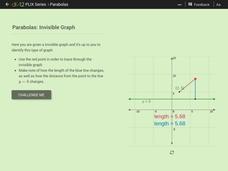
Parabolas: Invisible Graph
Envision the function as the point swings. Given a point connected to another point and a line, pupils trace through an invisible graph. Learners identify the name of the given point and the line and determine the type of conic section...
Ohio Literacy Resource Center
Solving Systems of Linear Equations Graphing
Do you need to graph lines to see the point? A thorough lesson plan provides comprehensive instruction focused on solving systems of equations by graphing. Resources include guided practice worksheet, skill practice worksheet, and an...
Mathematics Vision Project
Quadratic Functions
Inquiry-based learning and investigations form the basis of a deep understanding of quadratic functions in a very thorough unit plan. Learners develop recursive and closed methods for representing real-life situations, then apply these...


