Curated OER
Continuous Probability Distributions
In this continuous probability distribution worksheet, students identify discrete and continuous distributions. They calculate the linear combination of the independent normal random variable and determine probabilities using exponential...
Curated OER
Continuous Probability Distributions
Students practice continuous probability distributions. For this probability lesson, students calculate probability, use probability functions, and use rectangular distribution.
EngageNY
Discrete Random Variables
You don't need to be discreet about using the resource on discrete variables. In the fifth installment of a 21-part module, scholars explore random variables and learn to distinguish between discrete and continuous random variables. They...
Virginia Department of Education
Normal Distributions
Pupils work to find probabilities by using areas under the normal curve. Groups work to calculate z-scores and solve real-world problems using the empirical rule or tables.
Curated OER
4 Discrete Probability Distributions
High schoolers read and complete problems on how to solve discrete probability distributions. In this probability distributions lesson plan, students read math problem examples and solve them.
Curated OER
Normal Distribution
Students complete problems on normal distribution equations. In this algebra lesson plan, students complete 11 problems out of their text book.
Curated OER
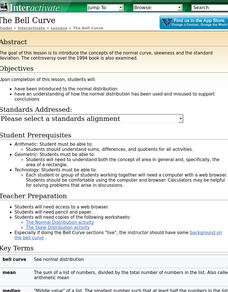
The Bell Curve
Learners are introduced to the concepts of the normal curve, skewness and the standard deviation. They discuss how the normal distribution has been used and misused to support conclusions.
Curated OER
Investigation-Pattern/Functions
Students explore number patterns. In this number patterns and probability math lesson, students work in groups to describe the patterns present in the first five rows of Pascal's Triangle, then write numbers to continue this pattern....
Curated OER
Why NP Min?
Students calculate the normal distribution. In this statistics lesson, students use the normal distribution to estimate binomial distributions. They define when to use NP and n(1-p) to make approximations.
Curated OER
Worksheet 15
In this math worksheet, students sketch and label on a number line the regions that converge and diverge with the sequences. Then they examine a smooth function and define its series.
Curated OER
The Bell Curve
Students are introduced to the normal distribution and examine the bell curve controversy.
Curated OER
Data Collection
Students investigate qualitative and quantitative data. In this statistics lesson, students gather data on heights and weights of people and graph the distribution. Students discuss the differences between qualitative and quantitative data.
Inside Mathematics
Conference Tables
Pupils analyze a pattern of conference tables to determine the number of tables needed and the number of people that can be seated for a given size. Individuals develop general formulas for the two growing number patterns and use them to...
Virginia Department of Education
May I Have Fries with That?
Not all pie graphs are about pies. The class conducts a survey on favorite fast food categories in a lesson on data representation. Pupils use the results to create a circle graph.
Curated OER
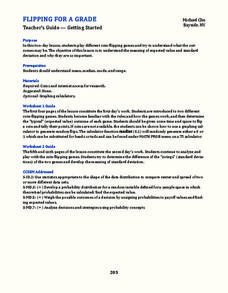
Flipping for a Grade
What happens when your teachers get tired of grading tests and want to use games of chance to determine your grade? How would you decide which game they should play? Learn how to use expected value and standard notation to compare two...
Inside Mathematics
Snakes
Get a line on the snakes. The assessment task requires the class to determine the species of unknown snakes based upon collected data. Individuals analyze two scatter plots and determine the most likely species for five additional data...
Inside Mathematics
Population
Population density, it is not all that it is plotted to be. Pupils analyze a scatter plot of population versus area for some of the states in the US. The class members respond to eight questions about the graph, specific points and...
Curated OER
Families and Neighborhoods
Students explore the concept of community. In this community lesson, students explore the cultural flavor of their neighborhoods as they discuss the history of their neighborhoods and draw pictures of their family and a building in their...
Curated OER
Lesson- Infinite Potential Well
Student create a numerical model which integrates Schrodinger's equation in 1 dimension. They discuss the properties of the solutions which match the boundary conditions. Student discusss any limitations if there are any in there model.


