Curated OER
Unit 13: Graphs, Correlation, Line of Best Fit
Students explore the concepts of graphs, correlations, line of best fit, and the dipstick problem. In this graph, correlation, line of best fit and dipstick problem lesson, students solve problems on the above mentioned topics. ...
Curated OER
Introduction to Scatter Plots and Correlation
Students examine the concept of scatter plots. They compare baseball statistics to locate the ones that correlate with winning, and identify the positive, negative, and no correlation in sets of data using MS Excel.
Kenan Fellows
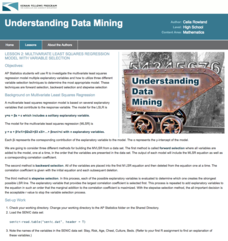
Multivariate Least Squares Regression Model with Variable Selection
The risk of contracting an infection in the hospital is low, but it does happen. Learn what risk factors have the highest correlation with hospital-acquired infections in the final lesson of a three-part series. Using the open source R...
Kenan Fellows
Least Squares Linear Regression in R
The task? Determine the how effective hospitals are at reducing the rate of hospital-acquired infections. The method? Data analysis! Using an open source software program, individuals use provided data and create scatterplots to look for...
Curated OER
The Barbie Bungee Drop
What do math, bungee jumping, and Barbie® have in common? Young adventure seekers use rubber bands as bungee cords to predict a thrilling, but safe, jump for their doll. First, test jumps are conducted with a few rubber bands. Then more...
Curated OER
Barbie Bungee
Middle and high schoolers collect and analyze their data. In this statistics lesson, pupils analyze graphs for linear regression as they discuss the relationship of the function to the number of rubber bands and the distance of the...
Curated OER
Animal Brains
Do big bodies make big brains? Let your learners decide whether there is an association between body weight and brain weight by putting the data from different animals into a scatterplot. They can remove any outliers and then make a line...
Curated OER
Integration: Statistics, Scatter Plots and Best-Fit Lines
In this math worksheet, students identify the type (if any) of correlation on 6 scatter plots. They use information given on a table to create a scatter plot and identify the type of correlation. Students use the scatter plot to make...
Curated OER
Means of Growth
Students collect and graph data. In this statistics lesson, students analyze their plotted data using a scatter plot. They identify lines as having positive, negative or no correlation.
Curated OER
The Regression Line and Correlation
Students investigate the best fit line through plotting on the TI. In this math instructional activity, students examine their data representing regression lines and correlation. They use interactive technology to differentiate between...
Curated OER
Correlation and Regression
In this statistics workshop young scholars find the value of linear correlation coefficients in three situations. Students find equations of the regression lines for 4 problems.
EngageNY
Modeling a Context from Data (part 2)
Forgive me, I regress. Building upon previous modeling activities, the class examines models using the regression function on a graphing calculator. They use the modeling process to interpret the context and to make predictions based...
Curated OER
The Frog Experiment
Your science class reads a silly story in which a mad scientist makes absurd conclusions about an experiment that he conducted. One at a time, he cuts off a frog's leg and commands it to jump. With three, two, and one leg, the frog...
Curated OER
Correlation And Strata: Findasaurus
Students use fossils to correlate and locate the correct strata, and determine where in those strata dinosaurs might be found. They see it is now possible to see how dinosaur fossils can be traced from one place to another.
Curated OER
Curricular Correlations
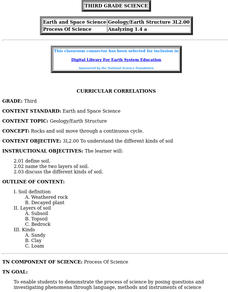
An interesting lesson on different types of soils is here for you. In it, learners discuss what soil is, and consider three piles of soil - clay, sand, and loam. During the rest of the lesson, third graders discover all sorts of...
Curated OER
Curricular Correlations
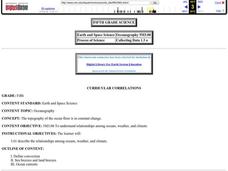
Here is a terrific way to teach your oceanographers about the effects that the ocean have on the weather and climate found throughout the world. In it, pupils engage in a science experiment designed to emulate how the ocean affects...
Curated OER
Changing Planet: Permafrost Gas Leak
Pair earth scientists up to use an amazing online arctic portal mapping tool and Google Earth to analyze permafrost changes. They compare changes to data on atmospheric concentrations of methane to see if there is a correlation. Then...
Mascil Project
Sports Physiology and Statistics
If I want to build up my heart, where should I start? Science scholars use statistics in a sports physiology setting during an insightful experiment. Groups measure resting and active heart rates and develop a scatter plot that shows the...
Curated OER
Sunspots: Correlating Sunspots to Active Regions
Students investigate sunspots. They use solar imaging from satellite instruments which are currently circling the sun. Students compare images from the satellites and determine the existence of a correlation between the two types of...
Curated OER
College or Bust?
Based on a New York Times article, "The College Drop-Out Boom," participants in a fishbowl discussion formulate and express opinions about the correlation between level of education, career options, and economic mobility. Ample...
Curated OER
Density of Rocks
Given a variety of rocks, junior geologists calculate densities and correlate them to Earth's layers. As a simulation of continental crust, they experiment with how materials of differing density float in water. Finally, they compare the...
California Institute of Technology
Physics of Light
Gummy bears are tasty, but did you know they are also used to determine color and light properties? Use the activity as a way to demonstrate light absorption, light reflection, and refraction with high schooler. Pupils conduct small...
West Contra Costa Unified School District
Families of Functions Sort
Have some fun with functions with a short activity that asks learners to first sort scatter plot in terms of their correlation. They then sort graphs of different types of functions in terms of key features, such as slope.
Curated OER
Linear and Quadratic Model, Data Modeling
Students model quadratic and linear equations. In this algebra instructional activity, students solve word problems using equations. They create scatter plots and make predictions using correlations.
Other popular searches
- Negative Correlation
- Number Correlation
- Coefficient of Correlation
- Correlation Coefficients
- Linear Correlation
- Analyzing Correlations
- Correlation of Data Sets
- Math Teks Correlation
- Scatterplots and Correlation
- Scatter Plots and Correlation
- Correlation and Causation
- Statistics Correlation


