Curated OER
Baseball Relationships - Using Scatter Plots
Students use graphing calculators to create scatter plots of given baseball data. They also determine percentages and ratios, slope, y-intercepts, etc. all using baseball data and statistics.
Curated OER
Using Excel to Draw a Best Fit Line
Young scholars create line graphs for given data in Microsoft Excel. Students follow step by step instructions on how to create their graph, including how to create a trend line. Young scholars print graphs without trend lines and...
Curated OER
Making Connections
Seventh graders relate patterns with higher math. In this 7th grade math instructional activity, 7th graders analyze different methods of portraying data. They relate the data to real life scenarios.
Curated OER
Impact!!
Young scholars perform a science experiment. In this algebra lesson, students collect data from their experiment and create a graph. They analyze the graph and draw conclusion.
Curated OER
Let's Get Physical
Students collect data using the CBL. In this statistics activity, students predict the type of graph that will be created based on the type of activity the person does. The graph represents heart rate depending the level of activity.
Curated OER
Fire!, Probability, and Chaos
Upper elementary and middle schoolers work with the concept of probability. They are introduced to the concept of chaos. Learners graph and analyze using a line plot, work with mean, and are introduced to the concept of variance.
Curated OER
Means of Growth
Students collect and graph data. In this statistics lesson, students analyze their plotted data using a scatter plot. They identify lines as having positive, negative or no correlation.
Curated OER
Investigating Factors That Affect Rate of Enzyme Action
Students explore the properties of enzymes. In this chemical reaction lesson plan, students explore enzymes through a Web-quest and investigative study. Students will collect and summarize data and create a class presentation. This...
Curated OER
Linear and Exponential Models
Students linearize data to determine if an exponential model is suitable. In this linearizing data to determine if an exponential model is suitable instructional activity, students graph the residuals of sets of data that appear to have...
Curated OER
Exploration Sequence of Bounces
New skills are developed as students use graphing calculators and ranger technology to capture and graph the sequence of bounces a ball makes when dropped. After recording the height of four or more bounces, they use the collected data...
Curated OER
Exploring Diameter and Circumference
Learn how to identify the diameter and circumference of a circle. Then, collect data on a circle and relate it to the diameter and circumference of a circle. Last, plot data and find the line of best fit.
Curated OER
Creating a Bar Graph Using a Spreadsheet: Dice Rolling Probabilities
Tenth graders explore the concept of spreadsheets. They create a simple spreadsheet and chart from given data. Students perform basic formatting procedures on their chart. They use spreadsheet functions to perform calculations.
Curated OER
Little Red Corvette
Learners investigate the acceleration of a car. In this acceleration of a car lesson plan, students make a scatter plot of corvette acceleration data. Learners find a model to fit the data by taking the integral of the curve created by...
Curated OER
Regressive Music
Student use the Ti calculator to graph sinusoidal graphs. In this calculus lesson, students use the CBL to collect and analyze data of sinusoidal graphs. They manipulate their collected data and make predictions.
Curated OER
Curve Ball
Create a Height-Time plot of a bouncing ball using a graphing calculator. Graph height as a function of time and identify the vertex form of a quadratic equation that is generated to describe the ball's motion. Finally, answer questions...
Curated OER
Optimization For Breakfast
Pupils identify he proportion of a cereal box. In this algebra lesson, students define the relationship between patterns, functions and relations. They model their understanding using the cereal box.
Curated OER
The King's Chessboard
Middle schoolers speculate on the better rate of pay: a dollar a day for 10 days, or a penny the first day, two pennies the second, doubling each day for 10 days. Start by listening to the story The King's Chessboard, by David Birch....
Mathematics Vision Project
Quadratic Equations
Through a variety of physical and theoretical situations, learners are led through the development of some of the deepest concepts in high school mathematics. Complex numbers, the fundamental theorem of algebra and rational exponents...
Curated OER
Mean, Median, and Mode
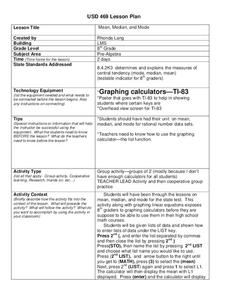
Eighth graders practice using the LIST key on graphing calculators using the proper syntax. They work with the functions of mean, median, and mode in a teacher led activity and then with a partner on a second data set. They follow...
Curated OER
Electric Field Mapping in 3D
Students create a 3D vector field map of an electric field. For this physics lesson, students measure the voltage inside an aquarium with water. They present their findings and map to class..
Curated OER
Slip Slide'n Away
Students analyze the sliding of boxes along a warehouse floor. In this algebra lesson, students connect math and physics by calculating the friction created by the sliding of each box. They develop faster method to move the box, based on...
Alabama Learning Exchange
The State Capital of Stem and Leaf
Students explore the concept of stem and leaf plots. In this stem and leaf plots lesson, students plot the 50 US states' capitals on a stem and leaf plot according to the first letter of each state. Students compare their stem and leaf...
Curated OER
The Expenditure Sheet
Students differentiate between expenditure and income. In this algebra lesson, students create a spreadsheet labeling the date, item and amount as they track their expenses. They format the cells of the spreadsheet to do all the...
Curated OER
Negative Exponents
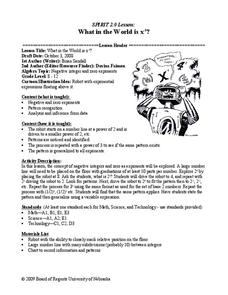
Students solve negative exponential functions. In this algebra lesson plan, students define the properties for rewriting functions with negative and zero exponents. They use a robot to create a visual of what is happening to the negative...


