Curated OER
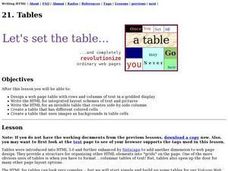
Tables
Students design a web page table with rows and columns of text in a gridded display. They write a HTML for integrated layout schemes of text and pictures. They create a table that has different colored cells.
Curated OER
Website Layout And Style
Students create a layout for a website and practice using FrontPage Express to create the tables for the layout. They use style sheets to mock up a design for a school web page with the school's logo. This is activity four in an eight...
Curated OER
Creating a Memorial
Students examine events that lead to the building of war memorials. They analyze the reasons why people build them and go to them. They create their own ideas for a memorial for the Mexican War.
Curated OER
Using GLOBE Data to Study the Earth System (College Level)
Students use the GLOBE Website to locate and study environmental data. They use the GLOBE Graphing Tool to display data. Students describe the role of solar energy in the annual fluctuations of soil moisture. They describe reservoirs and...
CK-12 Foundation
Matrices to Represent Data: Houndstooth
Apply matrices to fashion. Here your classes use a matrix to create a popular clothing design. As they construct the pattern, they review the dimensions of a matrix by considering the rows and columns.
Curated OER
Are You Full of Hot Air?
Explore the concept of measuring and recording circumference. For this physical science and measurement lesson, young learners blow up balloons, measure the circumference, and record the data on an interactive graphing website.
CK-12 Foundation
Symbiosis: Mutualism, Commensalism, and Parasitism
Hyenas normally hunt alone, however scientists discovered that in Israel, hyenas hunt with wolf packs. When relationships develop between different species, we call it symbiosis. The videos teach about the three types of symbiosis and an...
CK-12 Foundation
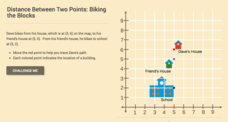
Distance Between Two Points: Biking the Blocks
Distance estimates would be easy if the world were a grid. Scholars work to determine the distance between two structures using a coordinate plane. As an introduction, the lesson focuses on vertical and horizontal distances.
CK-12 Foundation
Function Rules for Input-Output Tables: Soda Sugar Function Table
Examine the relationship between the input and output variables in a table of values. As learners build an input-output table using online manipulatives, they begin to identify patterns. They answer questions about these patterns and...
CK-12 Foundation
Stratified Random Sampling: An Extracurricular Study
Learning isn't a random process. A well-designed interactive lesson helps classes make key conclusions about stratified random sampling. They calculate group percentages and use those percentages to decide on sampling totals.
CK-12 Foundation
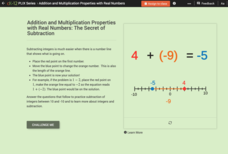
Addition and Multiplication Properties with Real Numbers: The Secret of Subtraction
An interactive boosts mathematicians' knowledge of subtracting integers using a horizontal number line by way of multiple-choice, true or false, and discussion questions.
CK-12 Foundation
Basic Inverse Trigonometric Functions: Ladder
Lean a ladder against the wall to create an angle. Class members use an interactive application to determine the angle a ladder makes with the ground. Individuals respond to five questions using inverse trigonometric functions.
CK-12 Foundation
Conversion between Degrees and Radians: Clock Angles and Measures
It's 3:30, what radian is it? Pupils create clock angles on a clock and determine the radian measure to the minute hand. They then use a conversion factor to convert from one measurement to another.
CK-12 Foundation
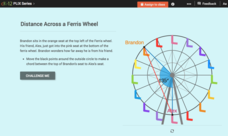
Length of a Chord: Distance Across a Ferris Wheel
An interactive presents two friends on a ferris wheel with the task of finding the distance between the them. Pupils create the chord between the two friends and calculate its lengths using trigonometric ratios.
CK-12 Foundation
Fitting Lines to Data
Scatter the TV sales over weeks. Pupils create a scatter plot to display the number of TV sales over a period of several weeks. The interactive allows class members to create two lines of best fit. Then they determine which line fits...
CK-12 Foundation
Translation of Vectors and Slope: Rearranging a Classroom
Find out if vectors are equal in the classroom. Pupils use the interactive to create vectors showing the movements boys perform in rearranging classroom furniture. The scholars determine which boy moved furniture the farthest, or if they...
CK-12 Foundation
Venn Diagrams: Planets and Dwarf Planets of the Solar System
Yes, Venn diagrams are helpful in science, too. Learners use an interactive to classify celestial bodies as having moons, as dwarf plants, as both, or as neither. They answer a set of challenge questions based on the Venn diagrams they...
CK-12 Foundation
Angle Measurement: Fuel Gauge Angles
Once you start looking, angles appear everywhere in our daily lives. A creative lesson has learners use the angles created by a fuel gauge to practice the Angle Addition Postulate. They see how changing the angle parts does not change...
CK-12 Foundation
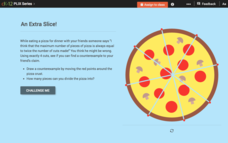
Conjectures and Counterexamples: An Extra Slice!
Class members will eat up an enticing interactive that lets users change the location of cuts made into a pizza to adjust the number of created slices. They create a counterexample for a conjecture on the number of slices.
CK-12 Foundation
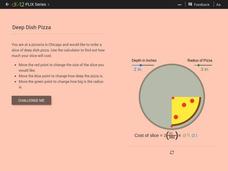
Linear Equations: Deep Dish Pizza
Explore the volume of solids with a real-life connection. Learners calculate the volume of a deep-dish slice of pizza to determine its price. They model the slice as a part of a cylinder and create a formula for calculating the cost.
CK-12 Foundation
Bar Graphs, Frequency Tables, and Histograms: Comparing Heights
Become a master at creating visual displays. Using a provided list of heights, users of the interactive create a bar graph and a histogram. They answer a set of challenge questions based on these data representations.
CK-12 Foundation
Displaying Categorical Variables: Spending Habits
Bar or circle graph—which is best? Given a circle graph and a total amount of money earned, pupils calculate the amount of money in each category. Learners use the calculated amounts to create a bar graph and compare the two displays.
CK-12 Foundation
Double Bar Graphs: Favorite Cookies Chart
It's just the way the cookie crumbles. Using the data from a class poll, learners create a double bar graph showing favorite cookie types. The pupils compare favorites between boys and girls with the aid of their graphs, then they make...
CK-12 Foundation
Mode: Boxes of Oranges
See how your data stacks up. Pupils stack crates of oranges in increasing order, creating a simple bar graph. Using the graph, individuals determine measures of center and describe the shape of the distribution. Scholars determine what...


