Curated OER
Global Carbon Cycle
Learners, in groups, create posters of the flow of a carbon atom as it travels through the carbon cycle. They make connections about how human activities affect the carbon cycle, as well.
Curated OER
Discovering Pi
Sixth graders discover Pi. In this discovering Pi lesson, 6th graders measure the diameter and circumference of various circular objects. Students record their measurements in a table. Students discuss how Pi relates to the...
Curated OER
Hard Water
In this water worksheet, students read how hard water is created and what can be done to soften the water. Then students complete 6 short answer questions.
Curated OER
Business 90 Midterm 2: Probability
In this probability worksheet, students examine given business situations and determine the probability of an event. They create tree diagrams and contingency tables. This nine-page worksheet contains 7 multi-step problems.
Curated OER
Composite Functions
Students create a poster to explain composite functions. In this composite function worksheet, students explore linear equations and functions. They complete a worksheet and use manipulatives to complete problems.
Curated OER
Patterns and Functions
Students investigate patterns and functions. In this algebra lesson plan, students examine the repetition of integers and objects. They create formulas for the repetition and identify them as function using equations.
Curated OER
Exponential and Exponents Functions
Young scholars solve problems using exponential properties. In this algebra activity, students differentiate between exponents, exponential and log functions. They graph their functions using table and exponents.
Curated OER
Creating a Nutrition Table in MicroSoftExcel
Students access the internet to find Nutritional information from a restaurant of their choice and compile their information into an excel spreadsheet.
Curated OER
Creating Bar Graph
Seventh graders, after an explanation and demonstration compare how many different places there at Cocowalk.
Curated OER
Veterans Day Remembered
Sixth graders gather information about Veterans and create a PowerPoint. In this Veterans remembered lesson plan, 6th graders interview a veteran and research on the computer to create a five slide PowerPoint.
Curated OER
Introduction to Science
Seventh graders investigate scientific methods to solve problems. They demonstrate creating data tables and graphs. They study the role of a scientist and the importance of safety in a science lab. They distinguish between an...
Curated OER
Rising Tensions Over The Nile River Basin
Students analyze the concept of global commons dilemma. In this investigative lesson students read an article on the Middle East Media Research Institute and answer questions accordingly.
Curated OER
The Circle Graph
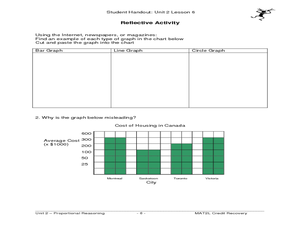
In this circle graph instructional activity, learners complete problems involving many circle graphs including a compass rose, degrees, and more. Students complete 7 activities.
Curated OER
Magical Metamorphosis
Sixth graders compare and contrast incomplete and complete metamorphosis using a Venn Diagram. They predict, observe, measure, and record data on the life cycle of mealworms. Students write and illustrate the life cycle of the mealworm....
Curated OER
Past and Present
Middle schoolers compare fossilized specimens to contemporary specimens. They use a computer and a Proscope Digital USB Microscope to collect and compare images of ferns, sand dollars and sow bugs to those of similar fossilized samples.
Curated OER
Search for Ice and Snow
Students use satellite images to locate areas of ice and snow on the globe. They create a table showing the information they gathered. They present their information to the class.
Curated OER
What a Hard Test!
Fifth graders complete an exercise that introduces them to Moh's scale of mineral hardness. The scale is presented on the worksheet, and learners answer three questions which have them assign a hardness rating based on some clues. For...
Curated OER
Community Celebrations
Sixth graders are introduced to cultural history and diversity that is present in the community in which they live by examining secular and sacred celebrations. Students create scrapbooks to chronicle their family's celebrations.
Curated OER
What Do Plants Need to Grow?
Fourth graders control variables to determine the effect on plant growth. They collect information by observing and measuring and construct simple graphs, tables, maps and charts to organize, examine and evaluate information.
Curated OER
And the Winner Is...
Third graders participate in an election project. They collect data to create a spreadsheet from which a graph is generated.
Curated OER
Graphing
Fifth graders create graphs based on climate in South Carolina. They read and interpret information in a chart and construct a graphy from the information in the chart. They create a spreadsheet using Excel and publish 2 graphs.
Curated OER
Inventors Unit Survey
Students develop and conduct a survey for their inventors unit. They create a five question survey and tally the survey results, and create a graph using Microsoft Word and Graph Club 2.0.
Curated OER
Groups Coming to America
Fifth graders use text or other references to locate different types of information about the Mayflower and pilgrims. They create a presentation for lower elementary classes about the Pilgrims.
Curated OER
Using technology to engage students in science through inquiry research
Students study animals and their behaviors. In this animal behavior lesson students divide into groups and collect data and research animal behaviors.


