West Contra Costa Unified School District
Graph Square Root and Cube Root Functions
Scholars first learn to graph square root and cube root functions by creating a table of values. They then learn how to graph functions from transformation of the graphs of the parent square root and cube root functions.
CK-12 Foundation
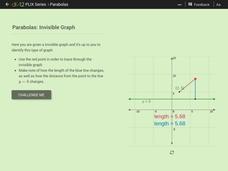
Parabolas: Invisible Graph
Envision the function as the point swings. Given a point connected to another point and a line, pupils trace through an invisible graph. Learners identify the name of the given point and the line and determine the type of conic section...
CK-12 Foundation
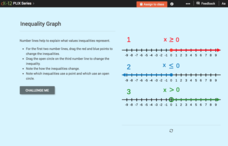
Inequality Expressions: Inequality Graph
Don't let inequalities be a drag. As young mathematicians drag the endpoint of the graph of an inequality in an interactive, the algebraic form of the inequality changes. This helps them see how the graph connects to the inequality.
Curated OER
The Human Graph
Students produce a graph of favorite colors. In this graphing lesson, students create a human graph based on their favorite color then the teacher transfers the data to a bar graph. Students compare the lines on the graph before...
Curated OER
Graph Paper Patterns
Young artists divide a piece of graph paper into sections using rectangles, squares, and triangles. They then fill each section with patterns of shape and color. Elementary graders describe how their patterns are organized. Secondary...
Curated OER
Graphing My Path to Success
Seventh graders examine their school performance through self-assessment of strengths and weaknesses. They construct a line graph, plotting all courses and achievements. Students use graph paper and colored pencils for each activity. If...
Curated OER
Learning to Read Graphs
What is your favorite pet? This is a great tool for youngsters just learning how to read and interpret graphs. There are four simple questions. Consider extending this activity by creating a class bar graph: how many learners have a dog,...
Curated OER
Correlation of Variables by Graphing
Middle and high schoolers use a spreadsheet to graph data. In this graphing lesson plan, learners determine how two parameters are correlated. They create a scatter plot graph using a computer spreadsheet.
Curated OER
Winter-time Temps
Students measure temperature and become aware the the temperature above and below the snow is different. In this winter temperature instructional activity, students measure temperatures to find variation based on how the snow is packed....
Curated OER
Red Worms Rock!
Second graders measure red worms. In this lesson plan, 2nd graders observe and collect data on red worms. Students measure the red worms and create a graph with the data they collect.
Houston Area Calculus Teachers
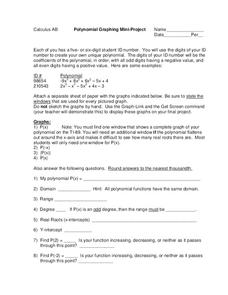
Polynomial Graphing
Your AP Calculus learners probably have their ID numbers memorized, but have they tried graphing them? Pique your pupils' interest by asking each to create a unique polynomial function based on their ID numbers, and then analyze the...
Curated OER
Explore Learning Exponential Functions
High schoolers graph exponential equations and solve application problems using exponential functions. They re-enact a story about a peasant worker whose payment for services is rice grains doubled on a checker board. They place M &...
Curated OER
Graphing Exponentials
Bring your Algebra class to the computer lab! Using materials created by Texas Instruments, they explore exponentiasl and graphs. Be sure to download the correct materials (on the right side of the webpage) before having them walk...
Curated OER
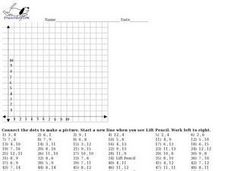
Graph Picture (Coordinate Pairs) 2
Looking for an engaging way to encourage your class to practice graphing coordinate pairs? This might be the activity you are looking for! For this worksheet, learners create a picture by plotting 54 coordinate pairs on graph and then...
NFL
Super Bowl: History and Anthology
The educational opportunities are overwhelming with this (almost) complete anthology and history of every Super Bowl since 1968. Excite your football enthusiasts with information that can be used to create cross-curricular activities in...
Curated OER
Graphing It Daily
Students identify and demonstrate a positive learning attitude and use basic concepts and skills. Learners also communicate clearly in oral, artistic, written, and nonverbal form. Finally, students participate in the daily data...
Curated OER
Using M&M's to Teach Bar Graphs
Motivate your class with this lesson plan. While not fully fleshed out, this activity is meant to be used as an introduction to the use of bar graphs. Learners sort M&M's and create bar graphs to display their information.
Mt. San Antonio Collage
Test 1: Functions and Their Graphs
Save the time creating an assessment because these function problems should do the trick. With 10 multi-part questions, they each focus on a different topic including radical, polynomial, linear and piecewise functions. The majority of...
Chicago Botanic Garden
Micro-GEEBITT Climate Activity
A truly hands-on and inquiry based learning activity bridges all the lessons in the series together. Beginning with a discussion on average global temperatures, young meteorologists use real-world data to analyze climate trends in order...
Curated OER
Barbie Bungee
Middle and high schoolers collect and analyze their data. In this statistics lesson, pupils analyze graphs for linear regression as they discuss the relationship of the function to the number of rubber bands and the distance of the...
Curated OER
The Barbie Bungee Drop
What do math, bungee jumping, and Barbie® have in common? Young adventure seekers use rubber bands as bungee cords to predict a thrilling, but safe, jump for their doll. First, test jumps are conducted with a few rubber bands. Then more...
Curated OER
Simple Graph Activity
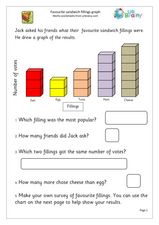
In this graphing activity, students interpret a simple bar graph of favorite sandwiches, answering 5 related questions and then conducting their own survey and creating a graph of the results.
Curated OER
Great Graphing
Young scholars collect data, use a computer spreadsheet program to create various graphs, and compare the graphs. They state the findings of each graph in writing and decide which graph type best represents the data.
Mathalicious
Domino Effect
Carryout the lesson to determine the cost of pizza toppings from a Domino's Pizza® website while creating a linear model. Learners look through real data—and even create their own pizza—to determine the cost of each topping. They explore...


