Curated OER
Mathematical Magazines
Students look through magazines and calculate the percentages of the types of ads in the magazines. For this percentages lesson plan, students create a graph to show their results.
Curated OER
Quadratic Relation and Parabola
Students identify the vertex and intercepts of a parabola. In this algebra instructional activity, students graph parabolas and factor quadratic equations. They perform transformation on the parabolas.
Curated OER
Seasons
Students explore the four seasons. Through observation activities, they explore and discuss the weather changes that occur during each season. Students create a graph of the clothing that is worn during each season.
Curated OER
Pea+Nut = Math
Students utilize peanuts to practice fractions. In this math model lesson, students solve multiplication problems and fractions with real peanuts. Students use drawing software to graph data from the math equations.
Curated OER
The Joy of Giving
Children identify wants and needs, bake and sell cookies to raise money, and then go to the mall to purchase gifts for Christmas stockings that are donated to the Salvation Army. They then perform Graphing activities to help children...
Curated OER
Jumping in the Air - What was your Height?
Learners solve equations using the quadratic formula. In this quadratic equations lesson, students use digital cameras to film learners jumping and import film clips into a computer. Students use the data in the quadratic formula...
Curated OER
S.T.A.R.S. Program
Students focus on qualities demonstrated by successful learners. They create a graph or chart to keep track of the STARS points.
Curated OER
Magnets 2: How Strong is Your Magnet?
Students work together to test the strengths of various types of magnets. After testing, they create a graph showing how the strength changes as the distance from the magnet increases. They discuss how forces can act from various...
Curated OER
Do You Live a Healthy Lifestyle?
Fifth graders examine and evaluate how active their own lifestyle is by counting how many steps they take on a daily basis. They watch a PowerPoint presentation about healthy lifestyles, record how many steps they take in a day with the...
Curated OER
Understanding Groundwater & the Effects of Pollution
Middle schoolers complete a unit on the effects of pollution on our water supply. They create a graph to examine the density of earth's land surface, round the population to the nearest hundred million place, participate in a...
Curated OER
Taste the Rainbow
Students practice estimating and graphing by utilizing Skittles. In this statistics lesson, students complete worksheets based on the likelihood of a certain color of skittle coming out of the bag. Students create a graph based on the...
Curated OER
Nanofibers: Why Go Small?
Young scholars explore the surface ratio of an object. In this surface area to volume lesson students construct a data table, make calculations and create a graph.
Curated OER
Population Demographics
Learners explore how life expectancy has been able to increase in recent years. In this population instructional activity students complete several activities and create a graph.
Curated OER
Reaching New Heights
Young scholars explore the tallest skyscrapers in the world over the past 100 years. In this technology lesson plan, students create a graph/time line about the evolution of skyscrapers. They research important facts about their assigned...
Curated OER
Percentiles
Students analyze the bell curve and make predictions. In this statistics lesson, students calculate the percentile to the left of the curve. They then are given the percentile and create the graph from the data.
Curated OER
Studies of the Eastern Worlds: Population Graphing
Seventh graders participate in several learning/research stations in which they view artwork from various countries of the Eastern world and collect information on the populations of the Eastern countries. They then use this information...
Curated OER
Design, Spin, and Graph
Students participate in a spinner activity and graph the results. They spin 10 times, tally the results, and discuss why the results occurred.
Curated OER
Tree Measurement
Young scholars work in pairs taking measurements of a tree. They measure the trunk, crown, and height using vertical and horizontal measurement. Then students create a bar graph using the information they gathered.
Curated OER
Modeling Population Growth
Young scholars create linear, exponential, and quadratic models of U.S. population data to determine which function best represents U.S. population growth. They predict future populations based on each model.
Alabama Learning Exchange
Human Slope
Middle and high schoolers explore the concept of slope. In this slope lesson, learners graph lines using a life-size graph. They use chalk on a blacktop to create a coordinate plane and use each other as the tick marks on the grid....
Curated OER
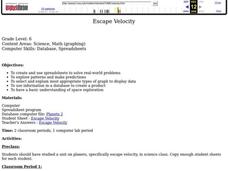
Escape Velocity
Sixth graders create/use spreadsheets to solve real-world problems, explore patterns, make predictions, select/explain most appropriate types of graph to display data, use information to create product, and have basic understanding of...
Curated OER
Metrically Me!
Students define the parts of a database, search strategies to locate information electronically, create/modify databases, etc. and enter data into a prepared spreadsheet to perform calculations.
Alabama Learning Exchange
Yummy Apples!
Young learners listen to a read aloud of Gail Gibbons book, Apples and the story A Red House With No Windows and No Doors. They compare characteristics of a number of kinds of apples, graph them and create a apple print picture. Learners...
It's About Time
How Do Carbon Dioxide Concentrations in the Atmosphere Affect Global Climate?
Does carbon dioxide really affect temperatures across the world? This fifth installment in a six-part series investigates the relationship between carbon dioxide and global temperatures. Graphs created from genuine data help young...


