Curated OER
Generate Measurement Data Word Problems
Bar and line graphs are an excellent way to visually analyze data: give your scholars practice both analyzing graphs and creating their own! First, they examine five basic bar graphs, indicating the number of squares on specific days....
Curated OER
Generate Measurement Data Word Problems
Plot data for three word problems, each with a table of data. Learners create line plots for these, all of which have only single-digit whole numbers. The large text and few number of problems make this ideal as a whole-class warm up....
Curated OER
Generate Measurement Data Word Problems
Using a set of simple data, learners create a line plot to organize the information. This data includes only single-digit numbers and the highest number is six. Because the answer is explained and illustrated at the bottom, project this...
Willow Tree
Histograms and Venn Diagrams
There are many different options for graphing data, which can be overwhelming even for experienced mathematcians. This time, the focus is on histograms and Venn diagrams that highlight the frequency of a range of data and overlap of...
Code.org
Good and Bad Data Visualizations
Good versus bad data. Pairs rate online collections of data representations from good to bad and then suggest ways to improve the visualizations. The class then creates a list of best practices and common errors in data representations...
CPO Science
Science Worksheets
If you need an array of worksheets to augment your science lessons, peruse a collection of assignments that is sure to fit your needs. With topics such as metric conversion, the scientific method, textbook features, research skills,...
Curated OER
Probability Fun
What are the chances? Probability comes into play in this worksheet as mathematicians examine a circular chart with images, determining the possibility that the "spinner" will land on each of the images. Appropriate for younger...
Raytheon
Data Analysis and Interpretation
For this data analysis and interpretation worksheet, learners use charts, graphs, statistics to solve 42 pages of problems with answer key included.
Curated OER
Organizing Data
In this organizing data worksheet, 7th graders solve seven different types of problems related to data. They first identify the type of data as categorical, discrete or continuous from the information given. Then, students use Excel to...
Curated OER
Froot Loops to the Max- Pie 2
In this Froot Loops to the Max worksheet, students solve 2 different problems related to graphing data with a box of Froot Loops cereal. First, they complete the circle/pie graph using the given data including a key and a title for their...
Curated OER
Tally Charts
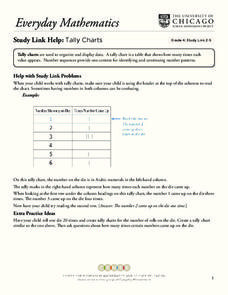
In this tally charts worksheet, learners discuss how to use a tally chart and how to read the chart. Once students record information on a tally chart they answer questions showing their ability to read a tally chart.
Math Moves U
Collecting and Working with Data
Add to your collection of math resources with this extensive series of data analysis worksheets. Whether your teaching how to use frequency tables and tally charts to collect and organize data, or introducing young mathematicians to pie...
Curated OER
Solar Storm Energy and Pie Graphs
For this solar storm energy and pie graphs worksheet, students solve 5 problems using pie graphs that show the amount of solar energy that is converted into radiation, kinetic energy, flare energy and flare energy that is lost to working...
Curated OER
What Color Are Your Eyes?
In this color of eyes worksheet, students conduct a survey to determine the number of students who have brown, hazel, blue or green eyes. The information is collected and then the data is organized. Students may use the data to create...
Curated OER
Statistical Inquiry
In this statistical inquiry worksheet, students analyze and interpret a variety of diagrams such as a scatter plot, bar graph and pie charts. They create tables and other diagrams to support given data. This two-page worksheet contains 3...
Curated OER
Histograms and Statistical Graphics
In this statistics worksheet, students solve 6 data problems. They construct a histogram of given data, they create a frequency polygon, and a stem and leaf diagram. Students create a dot plot and a pie chart for given data sets. On the...
Curated OER
Data Handling
In this data handling learning exercise, students explore multiple ways to represent data. They create stem and leaf plots, histograms, and bar charts. Students examine and interpret diagrams and statistics. This eleven-page learning...
Curated OER
Meatiest States: Graph Problem Solving
In this graph problem solving activity, students analyze a graph that shows commercial red meat production in five states. Students answer 5 word problems using the data on the graph.
Curated OER
Destination of Slaves in 1800
In this slave trade worksheet, learners use the provided Atlantic Slave Trade statistics to create a pie chart and a bar graph. Students also respond to 4 short answer questions.
K12 Reader
What Is a Glyph?
After reading a short passage about glyphs, kids must follow the provided directions to create a star glyph.
University of Utah
Geometry: Transformations, Congruence, and Similarity
Rigid motions are to congruence as what are to similarity? Investigate properties of rigid motions and define congruence in terms of rigid motions with the ninth chapter of a 10-part eighth grade workbook series. The lesson then prompts...
Curated OER
Simplifying Fractions
In this math worksheet, students create fractions to represent the pie graphs and then perform the operations to simplify the ratios.
Curated OER
Tally Chart Practice
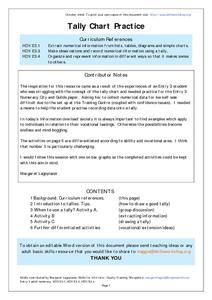
In this tally chart worksheet, students will read about tally charts and their uses. Students will make a list of when and why they could make a tally chart. Next students will complete a tally chart and write statements about the...
Open Text Book Store
Arithmetic for College Students: Worksheets
Loaded with concepts ranging from multiplying decimals to converting units to solving problems using the order of operations, a thorough practice packet is perfect for a fifth or sixth grade math classroom.


