Radford University
Are We Normal?
Develop a sense of normal. Learners develop two questions to ask classmates to gather numerical data before creating a box and whisker plot and a histogram to display their data. Class members make inferences and investigate the data...
Beyond Benign
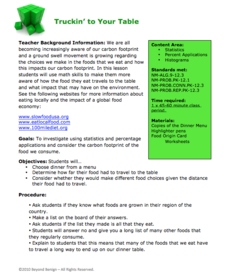
Truckin’ to Your Table
Food takes a trip to the table. Class members choose a meal from a menu and calculate the total cost of the meal including tax and tip. Using a food origin card, pupils determine how far each of the ingredients of a meal traveled to end...
Shodor Education Foundation
Stem and Leaf Plotter
The key is in the leaves. Pupils enter data to create a stem-and-leaf plot. The resource then displays the plot and calculates the mean, median, and mode of the data. Using the plot and the calculated measures of spread, learners analyze...
Achieve
BMI Calculations
Obesity is a worldwide concern. Using survey results, learners compare local BMI statistics to celebrity BMI statistics. Scholars create box plots of the data, make observations about the shape and spread of the data, and examine the...
CK-12 Foundation
Frequency Polygons: Constructing a Frequency Polygon
Connect the dots on frequency. Given a distribution table of scores on an assessment, learners create a frequency polygon by moving points on a graph to the correct frequency. The pupils use the display to answer questions about the...
EngageNY
Presenting a Summary of a Statistical Project
Based upon the statistics, this is what it means. The last lesson in a series of 22 has pupils present the findings from their statistical projects. The scholars discuss the four-step process used to complete the project of their...
CCSS Math Activities
Smarter Balanced Sample Items: High School Math – Target P
Learn how to show data in varied ways. A PowerPoint presentation provides six questions from the high school SBAC Claim 1 Target P item specifications. It covers creating data representations, interpreting and comparing data, and...
Radford University
Let's Buy a Car
Ready to buy a car? Learners research different makes and models of cars to decide on the best one to buy. They collect data on cost, fuel efficiency, safety ratings, and insurance costs, then create and analyze data displays to make...
Radford University
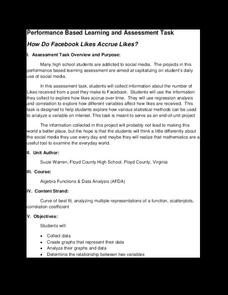
How Do Facebook Likes Accrue Likes?
Finally, a project pupils will instantly like! Young mathematicians collect data on the number of likes they receive for a social media post over time. During the first part of the project, they determine a curve of best fit and...
Georgia Department of Education
The Basketball Star
Have learners use math to prove they are sports stars! Assess a pupil's ability to create and analyze data using a variety of graphs. The class will be motivated by the association of math and basketball data.
Curated OER
Data Analysis Digital Display
Students create a survey online. In this math lesson, students graph survey data using flisti.com. They share and analyze their classmates' histogram.
Curated OER
Data Handling
In this data handling learning exercise, students explore multiple ways to represent data. They create stem and leaf plots, histograms, and bar charts. Students examine and interpret diagrams and statistics. This eleven-page learning...
Curated OER
Skittles, Taste the Rainbow
Fifth graders learn and then demonstrate their knowledge of a bar and a circle graph using the classroom data. Students are given a pack of skittles candy. Students create a bar and circle graph indicating the results of the contents of...
EngageNY
Connecting Graphical Representations and Numerical Summaries
Which graph belongs to which summary statistics? Class members build upon their knowledge of data displays and numerical summaries to connect the two. Pupils make connections between different graphical displays of the same data in the...
CK-12 Foundation
Graphs for Discrete and for Continuous Data: Discrete vs. Continuous Data
Not all data is the same. Using the interactive, pupils compare data represented in two different ways. The learners develop an understanding of the difference between discrete and continuous data and the different ways to represent each...
Curated OER
M&M’s Math Worksheet
Who knew you could cover prediction, histograms, fractions, decimals, data collection, and averages (mean, median, and mode) all with a bag of M&M's®? Here's a fantastic set of worksheets to help you make candy a mathematical journey...
College Board
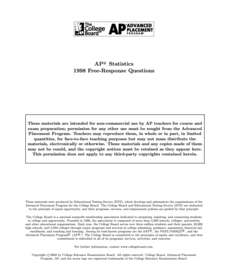
1998 AP® Statistics Free-Response Questions
Free-response questions form the 1998 AP® Statistics exam allow class members to analyze data from real-life situations. The situations include tracking defective parts, tracking butterflies, evaluating weed killers and determining...
K-5 Math Teaching Resources
Blank Bar Graph Template
This template is just begging for your young mathematicians to fill it in with colorful bar graphs! With horizontal and vertical axes in place and grid lines for added support, this is a great resource for teaching children how to...
Los Angeles County Office of Education
Assessment for the California Mathematics Standards Grade 5
Test young mathematicians' knowledge with an assessment aligned to California's fifth grade state standards. The exam covers a multitude of concepts including fractions and decimals, positive and negative numbers, measurement; and how to...
Virginia Department of Education
Analyzing and Interpreting Statistics
Use measures of variance to compare and analyze data sets. Pupils match histograms of data sets to their respective statistical measures. They then use calculated statistics to further analyze groups of data and use the results to make...
Curated OER
A Picture is Worth a Thousand Words
Pupils create various types of graphs. They go to suggested websites to collect data and create graphs to organize the data. Then they answer questions according to their graph.
Curated OER
Data Analysis Challenge
In this data analysis worksheet, young scholars work with a partner to collect information for a survey. The information is then compiled into a graph. Young scholars must indicate their survey question, the target audience, predict the...
Curated OER
Exploring Renewable Energy Through Graphs and Statistics
Ninth graders identify different sources of renewable and nonrenewable energy. In this math lesson plan, learners calculate their own carbon footprint based on the carbon dioxide they create daily. They use statistics to analyze data on...
Curated OER
M&M Graphing
Fourth graders name colors of M&Ms and record answers. They estimate number of M&Ms of each color found in a typical package of M&Ms on piece of paper.They record information on sheet of paper and create a spreadsheet. paper.


