California Education Partners
T Shirts
Which deal is best? Learners determine which of two companies has the best deal for a particular number of shirts. They begin by creating a table and equations containing each company's pricing structure. Individuals finish the seventh...
California Education Partners
Yum Yum Cereal
Design an efficient cereal box. Scholars use set volume criteria to design a cereal box by applying their knowledge of surface area to determine the cost to create the box. They then determine whether their designs will fit on shelves,...
Curated OER
Student Costs Graph
Students calculate the mileage, gasoline costs, and travel time and costs for a vacation. They conduct a virtual field trip, and create a comparison graph of costs using Microsoft Excel software.
Virginia Department of Education
Road Trip
Help plan a road trip with linear equations. Scholars consider two different rental car companies and write equations representing the cost for each company. They graph the system of equations to determine the conditions under which each...
Curated OER
House Project
Make young mathematicians' dreams a reality with this fun drawing project. Given the task of designing their dream home, students create drawings and physical models that demonstrate their understanding of proportion and scale.
Utah Education Network (UEN)
The Pasture and the Fence
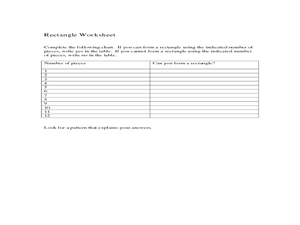
Beginning geometers use tiles and grid paper to draw and calculate perimeter and area. Rectangles of different sizes are created and then measured to build understanding. The one-inch grid sheet referenced is attached.
Curated OER
Pictograph to Bar Graph
Second graders explore organizing data to make it useful for interpreting picture graphs and bar graphs. They use Graphers software to create a pictograph and a bar graph.
California Education Partners
Photos
Why do all sizes of pictures not show the same thing? Class members analyze aspect ratios of various sizes of photos. They determine which sizes have equivalent ratios and figure out why some pictures need to be cropped to fit particular...
Curated OER
Virtual Field Trip
This hands-on resource has future trip planners analyze graphs of mileage, gasoline costs, and travel time on different routes. While this was originally designed for a problem-solving exercise using a Michigan map, it could be used as a...
Curated OER
Transforming Snoopy Using Coordinates
Students graph coordinate points to create a picture of Snoopy. In this coordinate point instructional activity, students read a book and learn about Rene Descartes' invention, the coordinate grid. Students graph a surprise picture on...
Curriculum Corner
7th Grade Math "I Can" Statement Posters
Translate the Common Core math standards into a series of achievable "I can" statements with this collection of classroom displays. Offering posters for each standard, this resource is a great way to support your seventh graders as they...
Curated OER
Sound Pictures
Young scholars examine the components of a sonar system. In this physical science lesson plan students explain how multibeam and sidescan sonar systems are useful to ocean explorers. Young scholars simulate sonar operations in an...
Curated OER
Marvelous Mathematics
Students make a table on the computer, but create fractions and equivalent fractions through the use of color. They are able to manipulate fractions in order to gain a greater understanding of the meaning of whole number that is broken...
Curated OER
Virtual Field Trip / Route, Mileage and Gasoline Cost Graphs
Young scholars use a spreadsheet program to graph and compare milage, gasoline costs and travel time for two travel routes in their virtual field trip in Michigan. They determine the most economical route based on the graphs and...
California Education Partners
Least and Greatest
Squares can be magic. Pupils use their knowledge of addition of positive and negative rational numbers to create a 3 X 3 magic square where the sums are 1. Scholars create addition and multiplication expressions with a set of rational...
Balanced Assessment
Fit-Ness
Serve four towns with one bus route. Pupils develop a bus route that meets certain criteria to serve four towns. They determine which of the routes would best serve all of them. Individuals then hypothesize where a fifth town should be...
Curated OER
Scatterplots and Regressions
In this scatterplots and regressions worksheet, students solve 6 different types of problems related to graphing scatterplots and interpreting regressions. First, they create a scatterplot from the given data coordinates and then,...
Curated OER
The Square Counting Shortcut
An excellent lesson plan that encourages students to discover how complex figures can be broken into simpler shapes when measuring area. Working with block letters, learners are given the freedom to develop their own strategies for...
Curated OER
Planning My Vacation Online
Students use a variety of resources to decide on a vacation destination. They locate three points of interest, a hotel, and two restaurants at their destination.Students obtain driving directions for their trip, create a trip budget, and...
Curated OER
Drawing to Scale
Students examine the process of drawing a picture to scale. They analyze and discuss real-life blueprints for a house, and create a scale drawing of an original invention using calculators and rulers.
Curated OER
Area, Perimeter and Rations Using Pentominoes
Learners of all ages investigate area and perimeter through pentominoes. In this geometry instructional activity, students calculate the are and perimeter of different geometric shapes and describe the properties of similar and congruent...
Curated OER
Solutions, Solutions, Could it Be?
Students graph and solve linear system of equations. In this algebra activity, students use algebraic and graphing methods to solve their systems. They find the point of intersection for their solution and draw inference from their data.
Curated OER
Frame Yourself
Young ratio masters calculate and cut a frame (out of poster board) to accurately create an even frame around a picture of themselves. The frame needs to be proportional to the picture with constraints determined by the instructor.
Curated OER
I'm Out of Here
Students create a travel budget. In this budget lesson, students research vacation destinations. Working independently, students research destinations on the Internet and construct a budget for the vacation. Resources provided.


