Curated OER
Price of Apples- Linear Data
Pupils collect data and create a graph. In this algebra lesson plan, students describe functions graphically, algebraically and verbally. They identify functions as being independent and dependent using variables.
Curated OER
Beginning Modeling for Linear and Quadratic Data
Pupils create models to represent both linear and quadratic equations. In this algebra lesson, students collect data from the real world and analyze it. They graph and differentiate between the two types.
Curated OER
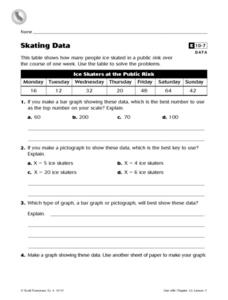
Skating Data
In this collecting data worksheet, 4th graders view a table on ice skaters at a public rink in order to answer 2 multiple choice questions, 1 short answer question and make a graph showing one piece of the data.
Curated OER
Gummy Bear Math
First graders predict, collect data, and create a graph based on gummy bear colors they are given. In this graphing lesson plan, 1st graders first predict how many colors of gummy bears there are. They then count the colors, graph them,...
Curated OER
Looking for More Clues
Fifth graders explore how to collect data and display it on a bar and circle graph.
Curated OER
Designing a Study
Students explore features to consider when designing a scientific study. In this science research instructional activity, students examine different methods of data collection and consider which method would be appropriate for...
Curated OER
How Many People Live in Your Household?
Students create a pictograph showing household size for the class.In this data collection and graphing lesson, the teacher guides students through the creation of a concrete object graph, then students analyze and summarize the results.
Curated OER
Charts, Maps, and Graphs Lesson on the Holocaust
Students practice interpreting data. In this Holocaust lesson, students research selected Internet sources and examine charts, maps, and graphs regarding the Jewish populations in and out of Europe. Students respond to questions about...
Curated OER
Math Journal: Functions and Coordinate Geometry
Fifth graders examine the many uses of coordinate grids. In this graphing lesson plan, 5th graders write data driven equations, discuss the x and y-axis, and determine if using 2 or 3 ordered pairs is better. Students complete several...
Curated OER
Ramp Builder
Learners plan and build a ramp designed for maximum distance a car can travel. In this physics and data collection math lesson plan, students work in groups to design a ramp using various household materials. Learners test small cars on...
Curated OER
Interpreting Line Graphs
Fifth graders interpret line graphs. In this graphing instructional activity, 5th graders first begin by reviewing the difference in bar and line graphs and what they are used for. Students practice interpreting the data on various line...
Curated OER
Make a Graph
In this graphing worksheet, 1st graders use given data to create a graph and answer questions. In this problem solving worksheet, students solve five problems.
Curated OER
How Much Will Movies Cost In The Future?
High schoolers use data collection and analysis, statistics, and probability in problem-solving situations and communicate the reasoning used in solving these problems.
Curated OER
What's in a Graph?
Learners explore how to use and interpret graphs. The graphs are pulled from a variety of sources, and the activities ask students to interpret graphs. They start this lesson with knowledge of what a graph is. Learners also know how to...
Mathalicious
Pic Me!
Finally! Math and Instagram have come together to discuss the correlation between likes and followers. High schoolers can't help but want to discover what makes one account more popular than another by developing a line of best fit and...
Curated OER
Venn Diagrams
The Venn diagram is such a useful tool! It can be used to provide a visual when comparing things across the curriculum. In this case, learners consider three Venn diagrams that each have a unique set of things in them. They must answer...
Curated OER
CSI Interdisciplinary Projects
Work across content areas with an engaging project that highlights higher-level thinking, teamwork, and a STEM focus.
National Research Center for Career and Technical Education
STEM: Lou-Vee Air Car
A comprehensive lesson plan on acceleration awaits your physicists and engineers! Two YouTube videos pique their interest, then sample F=ma problems are worked and graphed. The highlight of the lesson plan is the building of a Lou-Vee...
Curated OER
Worksheet 19: Ship Positions
In this math worksheet, students read informational paragraphs and then answer 18 questions using data from their readings. Questions are about vectors, positions, distance and orbits.
Curated OER
Bouncy Ball Collections
In this data table worksheet, students examine a table regarding bouncy ball data and respond to 4 questions regarding the data.
Curated OER
The Great Race
Learners identify the mean, median and mode of collected data. In this statistics lesson, students collect, graph and analyze data using central tendencies. They work in groups to collect data on a robot through an obstacle course.
Curated OER
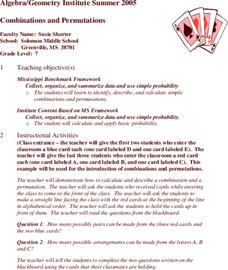
Combinations and Permutations
Fifth graders investigate the concepts of combinations and permutations using probability. They practice calculations using probability to measure the outcomes. Students demonstrate how to organize and categorize the data.
Curated OER
Data and charts
In this data and charts worksheet, students answer multiple choice questions referring to different charts about mountain heights, breakfast drinks, and more. Students complete 10 multiple choice questions.
Curated OER
Gathering, Recording, and Presenting Data
Sixth graders use the local newspaper to find and discuss examples of uses of statistics and the ways in which the information is presented. They create and represent their own set of data showing how students get to school each day.
Other popular searches
- Math Data Interpretation
- Math Analyzing Data
- Data/math Literature
- Math and Data Management
- Math Lesson Data Management
- Math Data
- Mathematics Chance and Data
- Math Lessons Organizing Data
- Math Data Collecting
- Math Bivariate Data
- Math/data Mean Mode Median
- Math Data Analysis


