Curated OER
Measures of Central Tendencies: Quartiles
In this statistics activity, learners calculate the mean, median, mode, range, lower quartile, and upper quartile for 10 questions and interpret a box and whiskers graph.
Mathed Up!
Cumulative Frequency and Box Plots
Learn how to display data. Young data analysts watch a video to review how to create cumulative frequency histograms and box plots. They work on a set of questions to practice producing these data displays.
Curated OER
Descriptive Statistics
Students demonstrate how to use frequency and scatter diagrams. In this statistics instructional activity, students are introduced to different techniques of representing data. Students sort and graph data on a worksheet and use a...
Curated OER
Live, From New York
In this data analysis worksheet, students study the information on a data table about the hosts of Saturday Night Live. Students answer 8 problem solving questions about the table.
Curated OER
The Histogram
In this Algebra I/Algebra II worksheet, students construct and analyze histograms to develop a visual impression of the distributions of data. The two page worksheet contains five problems. Answer key is provided.
Curated OER
Connecting Measurement
Students participate in activities the connect measurement to geometry, statistics, estimation, and the real world. They collect measurements from their elbow to the tip of their middle finger and make a box plot of the data as well as...
Curated OER
Understanding Statistics
In this statistics worksheet, students examine and interpret pictographs and line graphs. Students analyze the provided data in order to create bar graphs, circle graphs, and box and whisker plots. The nine page worksheet accompanies a...
Curated OER
Univariate Data Analysis
Students use given data to compare baseball players. They create box and whisker plots to compare the players and determine which they feel is the best player. Students use calculators to make box and whisker plots. They write paragraphs...
Curated OER
Minimum, Maximum and Quartiles
For this statistics worksheet, students identify the different parts of a whisker plot. They find the minimum, maximum and the three different quartiles. There are 8 multiple choice questions with an answer key.
Illustrative Mathematics
Haircut Costs
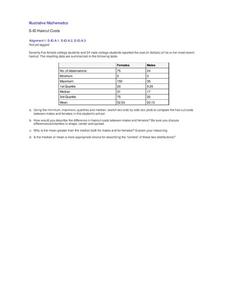
Who pays more for haircuts, men or women? Given quartile values, learners construct box and whiskers plots and interpret the results. They compare the mean and median, and discuss which is more appropriate under particular conditions....
Curated OER
How's The Weather?
Students make a box and whiskers plot using the TI-73 graphing calculator. Each student would have their own calculator but they would work in small groups of two or three to help each other enter the data and make the plots.
Curated OER
Breakfast Cereal - How Nutritious Is Yours?
Young scholars analyze the nutritional value of breakfast cereal in order to make an informed choice. They create a stem and leaf plot which analyzes the nutritional value of the cereal they eat on a regular basis. Students write a...
Curated OER
Statistics
In this statistics worksheet, 8th graders solve and complete 10 different problems that include the measures of variation in statistics. First, they determine the range, median, upper and lower quartiles, and interquartile range for each...
Curated OER
Estimating the Mile Record
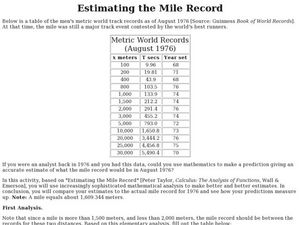
In this estimating the mile record, students examine given data. They use create a box-and-whisker plot to determine the upper and lower quartiles of the data. This one-page learning exercise contains 1 multi-step problems.
Inside Mathematics
Archery
Put the better archer in a box. The performance task has pupils compare the performance of two archers using box-and-whisker plots. The resource includes sample responses that are useful in comparing individuals' work to others.
Statistics Education Web
It Creeps. It Crawls. Watch Out For The Blob!
How do you find the area of an irregular shape? Class members calculate the area of an irregular shape by finding the area of a random sampling of the shape. Individuals then utilize a confidence interval to improve accuracy and use a...
Curated OER
Business & Statistics: Final Exam
In this business and statistics worksheet, young scholars read real-life business problems, arrange data, and identify the probability method best used to determine the answer. They identify the type of random sample, draw stem-and-leaf...
Curated OER
Box Plots
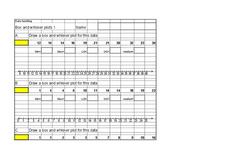
For this statistics worksheet, students analyze problems by finding the mean, median and mode. They also set data by their median, and quartiles. There are 7 questions dealing with 2 different sections.
Curated OER
Box-and-Whisker Plots
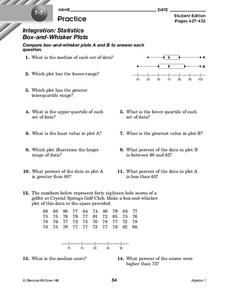
In this box-and-whisker plots worksheet, 9th graders solve and complete 14 different problems that include comparing various box-and-whisker plots. First, they determine the median for each set of data and plot the lesser range. Then,...
Curated OER
Statistics with State Names
Students analyze the number of times each letter in the alphabet is used in the names of the states. In this statistics lesson, students create a stem and leaf plot, box and whisker plot and a histogram to analyze their data.
Curated OER
Who's got the fastest legs?
Students use a stopwatch to collect information for a scatterplot. In this fastest legs lessons, students collect data through the taking of measurements, create and find a median number. Students develop an equation and answer...
Curated OER
Making Informed Decisions Using Measures of Central Tendency
Learners calculate the mean, median, mode, range, and interquartile range for a set of data. They create a box and whisker plot using paper and pencil and technology and determine which measure of central tendency is the most helpful in...
Curated OER
Introduction to Measures of Central Tendency and Variability
Learners calculate the mean, median, mode, range, and interquartile range for a set of data. They create a box and whisker plot using paper, pencil and technology.
Curated OER
Box and Whisker Plots
In this math learning exercise, students compute the median of sets of numbers. They create box and whisker plots. Students identify the median, upper and lower quartiles, and minimum/maximum amounts. On the last page of this learning...


