Curated OER
Can You Measure Up?
Here is a well-designed lesson plan on common standards of measurement for your young mathematicians. In it, learners calculate measurements in standard and non-standard units. They make predictions, record data, and construct and design...
Kenan Fellows
Sensors in Chemistry
The Environmental Protection Agency monitors sensors to track air pollution and set clean air standards. Enthusiastic young scientists use similar sensors to gather data in their area and then apply the gas laws and conservation of...
Curated OER
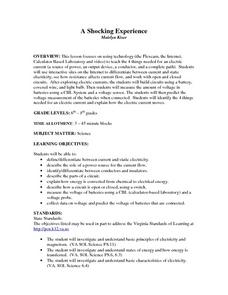
A Shocking Experience
Learners differentiate between current and static electricity, conductors and insulators, explain how energy is converted from chemical to electrical, measure voltage of batteries, collect data on voltage, and predict voltage of...
Curated OER
Float the Boat
Students collect data and analyze it using a graph. In this algebra instructional activity, students identify different bodies of water and relate the flowing to math. They collect data on the rate of flow and the height of flow. They...
Teach Engineering
Exploring Acceleration with an Android
Small groups use rubber bands to accelerate an Android device along a track of books. They collect the acceleration data and analyze it in order to determine the device's velocity.
Intel
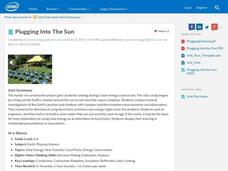
Plugging into the Sun
What's cooking? A sizzling STEM unit challenges scholars to build a solar cooker that can successfully cook an egg. The unit opens with a study of Earth's rotation, the sun's energy, and shadows. Pupils use a compass and thermometer to...
Curated OER
Computer Graphing
Students research the Internet or create surveys to find graphable data. They collect, organize, analyze and interpret the data. Finally, they choose the appropriate type of graph to display the data and find the measures of central...
Curated OER
Gingerbread Man Math
Students collect and explore gingerbread man data. In this math and technology lesson plan, students examine how to organize and interpret data in three formats: objects, pictures, and graphs.
Curated OER
Squares in the Light
Students collect and analyze data using a graph. In this algebra lesson, students explain their findings orally and with a graph. They use their knowledge to solve real life scenarios.
CK-12 Foundation
Two-Sided Stem-and-Lead Plots: Gamers
Which gender spends more time playing video games? Your classes use provided data to answer this question. They first build a two-sided stem-and-leaf plot and then use the display to look for patterns. Guiding questions help them...
Teach Engineering
Fun with Air-Powered Pneumatics
How high did the ball go? Engineering teams build a working pneumatic system that launches a ball into the air. The teams vary the amount of pressure and determine the accompanying height of the ball. An extension of building a device to...
Virginia Department of Education
Weather Patterns and Seasonal Changes
Get your class outside to observe their surroundings with a lesson highlighting weather patterns and seasonal changes. First, learners take a weather walk to survey how the weather affects animals, people, plants, and trees during...
Super Duper Publications
WH Question Cards - Pro: Who, What, When, Where, Why
Do you have kids on your caseload with wh questions goals, that need extra practice comprehending and asking who, what, when, where, and why questions? Then this clever app is designed for you!
Me and My Shadow
Trace My Shadow
Which creates more digital traces: surfing the Internet in a coffee shop, or using an iPhone to send a text message? The answer may surprise you! An interactive resource prompts users to choose which devices, operating systems, and...
EngageNY
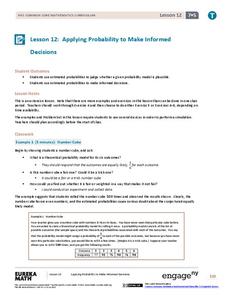
Applying Probability to Make Informed Decisions
Use simulations to determine the probabilities of events to make decisions. Class members are presented with several scenarios, some with known probabilities and others without. Groups run simulations to gather data that they then use to...
Curated OER
Antlion Pit Building Investigation
Students design and perform an experiment related to comparing and contrasting antlion pits. Given a set of parameters, students select a hypothesis and perform observations on antlion pits. They record data and use this date to support...
Curated OER
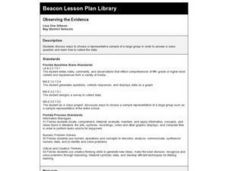
Observing the Evidence
Fifth graders explore how to do research from a large group. They explore how to choose a representative sample and collect data from it.
Curated OER
Bias in Statistics
Students work to develop surveys and collect data. They display the data using circle graphs, histograms, box and whisker plots, and scatter plots. Students use multimedia tools to develop a visual presentation to display their data.
NASA
Launch Altitude Tracker
Using PVC pipe and aquarium tubing, build an altitude tracker. Pupils then use the altitude tracker, along with a tangent table, to calculate the altitude of a launched rocket using the included data collection sheet.
New York State Education Department
English Language Arts Examination: August 2015
Assessing a variety of skills using numerous item types is a great way to collect data for formative and summative use. Using a challenging exam, scholars prove their comprehension and reading skills through multiple choice, task, and...
Curated OER
How to Graph in Excel
Fourth graders construct data graphs on the Microsoft Excel program. In this statistics lesson, 4th graders formulate questions and collect data. Students represent their results by using Excel.
Curated OER
Beginning Graphs in MS Excel
Students practice creating graphs in Microsoft Excel. In this technology lesson, students conduct a random survey and collect data. Students use the Microsoft Excel program to create a bar graph of the data.
Curated OER
Graphs and Spreadsheets
Students collect data and present it in a graph and/or a spreadsheet, depending on their previous understanding of technology.
Curated OER
Velocity
Students explore the concepts of velocity, acceleration, distance and football. They collect data on the velocity of a football and they determine the distance and height of a football when it is thrown. Students compare their findings...


