Space Awareness
Oceans on the Rise
Temperature rises and land disappears! Through a lab exploration, learners understand the effect of temperature increase on water similar to the effect of global warming on our oceans. As they heat the water in a flask, they measure the...
Kenan Fellows
Using Water Chemistry as an Indicator of Stream Health
Will this water source support life? Small groups test the chemistry of the water drawn from two different sources. They then compare the collected data to acceptable levels to draw conclusions about the health of the source. The...
Curated OER
Whale Migration - The Long Journey
Marine biology learners examine right whale sighting data from the WhaleNet website. They plot the data on a map and write down the number of adults and calves spotted. Questions accompany the data analysis activity, making this a...
Curated OER
Water Chestnut Graphing Activity
Students are taught how to format and enter data into an Excel spreadsheet. They make a graph and interpret graphed data. Students discuss possible impacts of water chestnut invasion. They graph data on water chestnut. Students report...
Curated OER
Exploring Photosynthesis with NASA Remote Sensing Data
Students explore photosynthesis using NASA satellite data. In this inquiry based biology lesson plan, students will look at data from a chosen national park to determine when the maximum amount of photosynthesis is occurring. This will...
Virginia Department of Education
Safety and the Material Safety Data Sheet
While many chemicals are used in biology class, many pupils don't understand the material safety data sheets. The lesson explains each part and the importance of understanding the forms. Young scientists use safety equipment to ensure...
Nuffield Foundation
Investigating the Effect of Temperature on the Activity of Lipase
How does temperature affect lipase activity? Young scholars conduct an experiment to collect data on the interaction of lipase at different temperatures. They add lipase to a solution of milk, sodium carbonate, and phenolphthalein and...
Curated OER
Winter Wonderland - Winter Olympics and the Water Cycle
After a concise introduction to the water cycle, junior meteorologists access NOAA's average snowfall data. They choose a city to examine in terms of precipitation. Then they look at historical snowfall data and use it to predict snow...
NASA
Observing Monsoon Weather Patterns with TRMM Data
Follow a fabulous slide show on how monsoons form and how satellite technology is being used to observe the phenomena, explaining why they occur. Afterward, visit the TRMM (Tropical Rainfall Measuring Mission) website to access actual...
Curated OER
Using Excel to Reference and Graph Live Data from a Web Site
Students collect live buoy data about water temperatures in the Gulf of Mexico from the Internet and work individually to organize their data and create a line graph using Excel Spreadsheet. Students analyze their data and examine any...
Curated OER
Drops on a Penny
Young scientists explore the concept of surface tension at is applies to water. In this activity, learners use a dropper to place drops of water on a penny. Each group guesses how many drops a heads-up penny will hold, then conducts the...
CK-12 Foundation
Broken-Line Graphs: Heating Curve of Water
Examine the unique graphs coined broken-line graphs. Using the phase change of water for data, learners answer questions related to the temperature and energy at different times in the cycle of the phase change. Questions focus on the...
NASA
Write the Book on Weather Metrics
It's not easy to measure the weather. Pupils learn about what all weather has in common—the atmosphere. Scholars discover how a meteorologists must be able to measure aspects of the atmosphere and decipher the data. They then create a...
Curated OER
Using Your Marbles - Volume Measurement and Reporting
Demonstrate how to measure the volume of liquids and solids immersed in liquid to your class. They observe a teacher-led demonstration, and in small groups construct a data table that demonstrates how many marbles were used and the...
NOAA
The Oceanographic Yo-yo
How does chemistry help deep-sea explorers? Part four of a five-part series of lessons from aboard the Okeanos Explorer introduces middle school scientists to technologies used in ocean exploration. Groups work together to analyze data...
Pingry School
The Water Lab – Spreadsheet Simulation
More than 70 percent of people and 90 percent of businesses use spreadsheets regularly. While many courses overlook the important skill, the simple water lab focuses on entering spreadsheet data, formatting it, and printing plots based...
Pulitzer Center
The Global Water Crisis
High schoolers examine the "quiet crisis," the lack of clean water, by reading articles and viewing video clips. They discuss the situations in Ethiopia, Yemen, Kenya, and Nepal. There are two options for the lesson, but one of them...
Teach Engineering
Water Remediation Lab
Water filtration — that's pure genius! Groups test the ability of a water filter to purify water by running chlorine contaminated water through a filter and measuring the chlorine concentrations as they filter the water. They then graph...
Curated OER
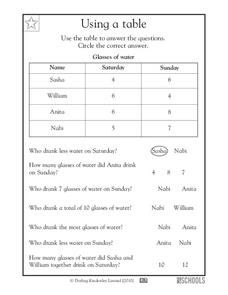
Using a Table
Tables are no help if your scholars can't read them; provide some excellent beginner-practice using this table example and accompanying comprehension questions. Learners examine the data first, which charts the number of glasses of water...
Curated OER
A Whale of a Story
Does sound travel faster in water or in the air? Put the question to the test with a science experiment. After reviewing a table of data, third and fourth graders decide which statements are true and which ones are false. The bottom of...
Curated OER
Amounts of Dissolved Oxygen in Various Bodies of Water
Young scholars test water to determine the dissolved oxygen content while displaying the proper use of testing instruments while visiting water testing sites. They determine if the amount of dissolved oxygen is appropriate for the tested...
National Wildlife Federation
How Do You Feel About Water?
Less than one percent of the water on Earth is usable in people's homes. As pupils consider this fact, they reflect on their own water usage before designing a survey to collect information on water usage by others. They then analyze...
Longwood University
How Can We Help Maintain Our Water Supply? Conserving Water
Make young citizens aware of their environmental impact early. An inquiry-based lesson helps learners analyze their own water usage patterns and understand the effects of their habits. Individuals look at data to spot trends and see how...
Curated OER
Tables
Can you read this table? Learners begin to comprehend data analysis through examining two simple tables and answering comprehension questions. The first gives characteristics about three animals in yes-or-no format (i.e. "eats insects,"...


