Curated OER
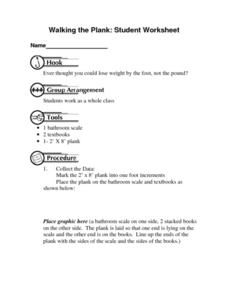
Walking the Plank: Student Worksheet
For this math worksheet, students will work in a group to experiment with the weight of objects when placed at a distance from a scale (using a plank). Students will record and graph their results.
Curated OER
Analyzing Graphs
In this statistics and probability worksheet, students analyze frequency distribution tables or histograms and box and whisker plots. The two page worksheet contains four multiple choice questions. Answers are included.
Curated OER
Mean Median and Mode
Young scholars collect data, graph it and analyze it. In this statistics lesson, students plot their data and calculate the mean, median and mode explaining how it relates to the data. They define the ways to find the mean, median and mode.
Curated OER
Graphing of Time and Distance
In this graphing time and distance worksheet, students graph data of a two race cars as they drive over time. Students plot the time vs. the distance for both cars and answer questions about the data. They determine the speed of the cars...
Curated OER
Mine Shaft Grade 8 Slope
Eighth graders investigate slopes using real life scenario. For this algebra lesson, 8th graders model and interpret real life data. They plot their data in a coordinate plane and discuss the results with the class.
Curated OER
Become the Meteorologist
Seventh graders analyze the data from Hurricane Tracking maps. In this earth science lesson, 7th graders plot data points on their maps and predict where the storm will most likely hit. They compare their prediction with the actual storm...
Curated OER
The Apple Orchard Problem
Students explore various approaches to solving a problem of maximizing the total production of apples in an orchard. In this apple orchard instructional activity, students collect data in order to solve the apple orchard problem...
Curated OER
Go Car, Go!
Learners design and build their own car. In this physics lesson, students collect data to determine the speed of the car. They plot the data on the graph analyze the relationship between variables.
Curated OER
Do We Have More Boys Or Girls in Our Classroom?-- Class Bar Graph
For this math worksheet, students participate in a group project to graph the number of boys and girls in their classroom and plot the data on a simple bar graph.
Curated OER
Absolute Zero Lab
In this absolute zero worksheet, learners experiment with a closed-end syringe and a ice bath and boiling water. They record volumes of gases in the syringe as well as temperatures of the water and they plot their experimental data. They...
Curated OER
Boyle's Law Lab
For this gas lab, students use a pressurized soda bottle with a closed end syringe to simulate Boyle's Law. They alter the volume and watch the effects on the pressure of the gas. They plot their data and answer eight post lab questions.
Curated OER
Regents Exam
In this math worksheet, students perform basic operations all the way up to precalculus. They graph, identify slopes, plot data and analyze it. There are 34 questions.
Curated OER
Heart Smart in a Heart Beat
As an introductory activity, young statisticians measure their heart rate at rest and after exercise and compute the mean and median, and create a box & whisker plot. This is followed by watching a video (that no longer seems to...
Curated OER
Writing About the Indian Monsoon (Calibrated Peer Review):
Students develop an understanding of the atmospheric processes underlying the Indian Monsoon. They explore the use data to make a scientific argument. They listen to lecture on atmospheric circulation processes.
Curated OER
The Origins and Maintenance of Earth's Atmosphere
In this atmosphere worksheet, learners read over a data table showing the percentage of carbon dioxide, oxygen and nitrogen in the atmosphere over the last 4500 million years. Students create a graph comparing these gases over time and...
Curated OER
The Correlation Between Human Population Growth and Dwindling Natural Resources
Eighth graders predict human population growth. In this lesson, 8th graders discuss the length of time needed to double the human population, work in groups to chart population growth and predict population growth in the...
Curated OER
Lesson Plan On Fran Data
Seventh graders investigate the concept of functions and how they are used in the context of the real world while identifying the dependent and independent variables. They graph relations and functions and find the zeros of functions....
Curated OER
Hurricanes-Disasters In the Making
Sixth graders discover the proper methods for plotting hurricanes while developing their understanding of hurricanes by researching and gathering tracking data from technological sources. Students develop a newsletter about hurricanes,...
Curated OER
Baseball Statistics
Students take an in depth examine baseball record breakers. They calculate statistics, not just for one year, but over whole careers, to compare some famous players and find who was the best all-time home run hitter.
Curated OER
Word Problems: "Leaving D.C."
In this solving math story problems learning exercise, students read statistics from the Student edition of USA Today to solve word problems. Students solve 6 problems.
Curated OER
Perimeter Pattern
High schoolers investigate perimeter patterns formed by a hexagon and a triangle. They will identify the dependent and independent variable and write a function for the relationship.
Curated OER
Spaghetti Bridges: Student Worksheet
In this math worksheet, students will create a "bridge" out of spaghetti and test it's strength with pennies. Students will record their results on a table and then graph the results.
Curated OER
Lessen the Loan
Middle-schoolers explore the concept linear equations. They use the internet to navigate through videos and problems. Pupils problem solve to determine rates of change, slope, and x and y-intercepts.
Statistics Education Web
Sampling in Archaeology
Compare different random sampling types using an archaeological setting. Scholars collect data from an archaeological plot using simple random samples, stratified random samples, systematic random samples, and cluster random samples....


