Curated OER
Canada's Immigration patterns: 1950 to Present
Learners examine the changing immigration pattern of Canada. In this immigration activity, students use statistical data from a web-site to complete a worksheet and graph their findings.
Curated OER
Mean and Median
Students identify the different central tendencies. In this probability lesson, students create the correct type of graphs to analyze their data. They make predictions and draw conclusions from their data.
Curated OER
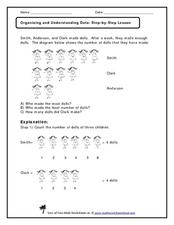
Organizing and Understanding, Step-by-Step
Use this number comparison and counting worksheet as an overhead projection for the whole class, because the answer is explained on the bottom half of the sheet. Cover the answer and reveal it once learners have tried it themselves. They...
Curated OER
Investigating the Effect of Minerals on Plant Growth
How do different minerals affect the growth of plants? Budding botanists find out in a multi-week experiment that has them using solutions with specific mineral deficiencies. While there is a lot of preparation for the investigation,...
University of Wisconsin
Noting Notable Features for Rain Gardens
Eight groups in your class are each responsible for a different aspect of surveying the campus for a suitable rain garden location. Features to consider include water flow, topography, sun/shade patterns, land surface, vegetation,...
Curated OER
Bodacious Buttons
First graders graph a data set. Given a set of buttons, 1st graders sort them into categories using specific attributes. They graph the number of buttons in their set based on their attributes using a variety of graphs. Students share...
Curated OER
Roaring Twenties: The Impact of High School on its Students Over Time
Eleventh graders compare the American high school experience of the 1920's to today. In this historical perspectives lesson, 11th graders examine surveys from 1924 high school students and then create their own surveys for today's high...
Curated OER
Build Your Own Car
Learners design and build their own cars. In this physics instructional activity, students test their car's speed and make changes when necessary. They graph data and analyze results.
Curated OER
Hot Rocks
Students demonstrate that setting of plaster and cement is a change, which involves a release of heat energy, use data collected experimentally to construct comparison graphs and analyze the graphs to make predictions about future...
Curated OER
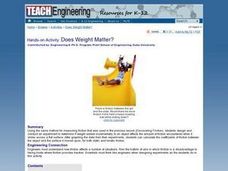
TE Activity: Does Weight Matter?
Young scholars design and conduct experiment to determine if weight added incrementally to an object affects amount of friction encountered when it slides across a flat surface. They graph data from their experiments, and calculate...
Curated OER
Fuel Mystery Dis-Solved
Pupils describe how temperature and surface area exposure affect the rate at which fuel is consumed. They explain why engineers want to know about the properties of a fuel when designing rockets. They create a bar graph of result data.
Curated OER
Density of a Sinker
Eighth graders determine the density of a sinker by first finding the mass and then the volume using a graduated cylinder. Students must write the procedure they use to find the volume of the sinker then apply their data to follow-up...
Curated OER
Gathering, Evaluating, And Organizing Information for a Report
Students gather and organize information for a research report on a topic of their choosing. Each students selects a subject for their research. Using traditional and electronic data they reference four or more appropriate resources...
Curated OER
Move To a Healthier Aquatic Balance
Fourth graders examine aquatic orgnaisms and how enviromental chages affect them. This factors include: temperature, Ph, oxygen, nutrients, and pollutants. They also explore habitat quality (erosion). Students compile data and create...
Curated OER
Using Excel to Draw a Best Fit Line
Students create line graphs for given data in Microsoft Excel. Students follow step by step instructions on how to create their graph, including how to create a trend line. Students print graphs without trend lines and manually draw...
Curated OER
Writing a Research Paper
Students work through the steps of writing a research paper in this lesson. They define their problem and decide what sources of information to use. They read, take notes, and organize the collected data. Finally, they write the...
Curated OER
Family Activity: Bar Graphs and Line Graphs
For this math worksheet, students work at home with a family member on a graphing activity. Students count the number of cans, glass jars, boxes and bags in the pantry. Students make a bar and a line graph to represent the data.
Curated OER
Energy Efficiency in the Home
Students discover ways to conserve energy in their homes. In this energy efficiency lesson students analyze a set of data and design a solution that results in higher energy efficiency.
Curated OER
Malnourishment and Poverty
Students discover how poverty impacts people in many developing countries. In this Student Voices against Poverty instructional activity, students calculate data on numbers of children suffering from Vitamin A deficiency and numbers of...
Curated OER
Plotting Slave Population Density in Connecticut in the 1700's
Tenth graders explore slavery in the U.S. by researching the web. In this U.S. history instructional activity, 10th graders identify the geography of Connecticut and the overall involvement the state had in the slavery process. Students...
Curated OER
Planet Research and Brochure
Fourth graders design a brochure based on the planet that they researched. In this planets lesson plan, 4th graders include the data, important facts, and completed as a team.
Curated OER
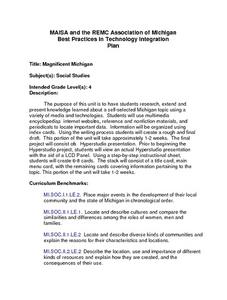
Magnificent Michigan
Fourth graders complete a research project about the state of Michigan. They conduct Internet research, organize the information on index cards, and create a HyperStudio presentation.
Mathematics Vision Project
Quadratic Functions
Inquiry-based learning and investigations form the basis of a deep understanding of quadratic functions in a very thorough unit plan. Learners develop recursive and closed methods for representing real-life situations, then apply these...
Mascil Project
Parachute Food Drop
Drop a perfect project into your lesson plans. Groups use different building materials to create models of parachutes for food drops. After testing out their prototypes, they make improvements to their designs.


