Curated OER
Fish Communities in the Hudson
Learning to read data tables is an important skill. Use this resource for your third, fourth, or fifth graders. Learners will will study tables of fish collection data to draw conclusions. The data is based on fish environments in the...
K12 Reader
Displaying Data
It's important to learn how to display data to make the information easier for people to understand. A reading activity prompts kids to use context clues to answer five comprehension questions after reading several paragraphs about...
Curated OER
Virtual Field Trip: Lesson Ten - Publishing
Class members publish a letter describing their Virtual Field Trip incorporating data from previously developed charts, graphs, and data tables. The final lesson in a series devoted to collecting information and publishing data.
Curated OER
"Data Dabble"
Students engage in a lesson which facilitates their use of web sites to find data, graph it, and interpret it, thus scaffolding graphing skills to prepare students for their 8th grade I-search exit project.
Curated OER
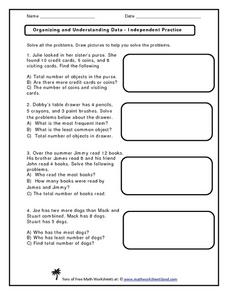
Organizing and Understanding Data - Independent Practice
Provide your first graders with an opportunity for independent practice organizing and understanding data. The ten story prompts on this three-page activity asks learners to solve problems involving concepts of the total number of...
Curated OER
Converting Units Of Length
Use this converting units of length activity to have your charges fill out a table, find the perimeters to three shapes and calculate the answers to three word problems.
Curated OER
Data Handling
In this data handling worksheet, 6th graders solve and complete 4 various types of problems. First, they draw a bar chart to represent the information provided in the table shown. Then, students show beneath the table how to work out the...
Curated OER
Twelve Days of Christmas--Prediction, Estimation, Addition, Table and Chart
Scholars explore graphing. They will listen to and sing "The Twelve Days of Christmas" and estimate how many gifts were mentioned in the song. Then complete a data chart representing each gift given in the song. They also construct...
Florida Center for Instructional Technology
Integrating Mathematics into Literature
You class will read Cucumber Soup by Vickie Leigh Krudwig as an anticipatory set for this lesson plan on ratios. They make models of the insects in the story and then use them as a source of data for this ratio and proportion lesson...
Curated OER
Collecting and Analyzing Data
In this collecting and analyzing data worksheet, students collect data from an experimental investigation about the relationship between the color of a Tootsie Roll Pop and the time it takes to get to the chocolate center. ...
Curated OER
Tables, Charts and Graphs
Students examine a science journal to develop an understanding of graphs in science. In this data analysis lesson, students read an article from the Natural Inquirer and discuss the meaning of the included graph. Students create a...
Curated OER
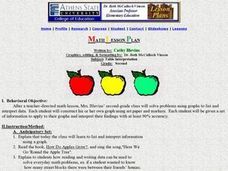
Table Interpretation
Students solve problems using graphs to list and interpret data. Each student construct his or her own graph using art paper and markers. They be given a set of information to apply to their graphs and interpret their findings.
Curated OER
The Gathering and Analysis of Data
Young mathematicians gather data on a topic, graph it in various forms, interpret the information, and write a summary of the data. They present their data and graphs to the class.
Curated OER
Investigating: Interpreting Graphs and Analyzing Data
Students explore statistics by researching class birthday data. In this data analysis instructional activity, students investigate the different birthdays among their classmates and create data tables based on the given information....
Albert Shanker Institute
Economic Causes of the March on Washington
Money can't buy happiness, but it can put food on the table and pay the bills. The first of a five-activity unit teaches pupils about the unemployment rate in 1963 and its relationship with the March on Washington. They learn how to...
Curated OER
Organizing and Interpreting Data
In this organizing and interpreting data worksheet, students solve and complete 10 different problems related to reading various data tables. First, they complete the 3 charts shown with the correct tally amount, frequency amount, and...
Curated OER
Wind Effects- A Case Study
Learners explore hurricanes. For this weather data interpretation lesson, students draw conclusions about the impact of Hurricane Floyd as it related to weather conditions. Learners read and interpret a tide data table, a barometric...
Scouts
The Deadly Picnic: A Lab on Deductive Reasoning
Whodunnit? Find out who killed Mr. Brooks through a logical examination of evidence. Class members fill out a couple of data tables to help them pin down the suspect. After they've figured out just who the culprit is, pupils compose...
Newspaper Association of America
Power Pack: Lessons in Civics, Math, and Fine Arts
Newspaper in Education (NIE) Week honors the contributions of the newspaper and is celebrated in the resource within a civics, mathematics, and fine arts setting. The resource represents every grade from 3rd to 12th with questions and...
Curated OER
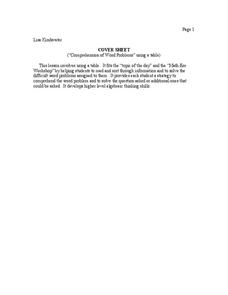
"Comprehension of Word Problems" Using a Table
Sixth graders practice solving math problems by utilizing a data table. In this number sense lesson, 6th graders create a table using the numerical information about a fictitious farm's inventory. Students complete the empty segments by...
Curated OER
Angles and Arcs
In this angles and arcs activity, 10th graders solve 18 various types of problems related to determine various angles and arcs of a circle. First, they find the measure of each angle and arc of the first circle shown. Then, students...
Curated OER
Cricket Weather
In this collecting data worksheet, 4th graders use the data collected on crickets chirps and the temperature to make a line graph by following 4 directives.
Curated OER
Reading the Neighborhood
First graders complete activities with the story One Monday Morning in the Macmillan/McGraw Hill Textbook. For this data lesson, 1st graders read the story and gather data to create a picture graph. They read the graph and answer...
Curated OER
Days and Seasons
Introduce young scholars to calendars as they practice the days of the week and four seasons. First graders complete three days-of-the-week sequences, each starting on a different day. They can reference the completed sequence example...
Other popular searches
- Creating Data Tables
- Science Data Tables
- Making Data Tables
- Organizing Data in Tables
- Data Tables and Graphing
- Graphs and Data Tables
- Data Tables and Charts
- Create Data Tables From Graphs
- Data Tables Lesson Plans
- Data Tables Surveys
- Pocket Data Tables
- Using Data Displays


