Curated OER
Will There be Enough Water?
Students investigate water usage, water available, and water demand historically in the local area. They use projections of water usage, availability and demand up to the year 2050. Students use graphs to relate as well as compare and...
Curated OER
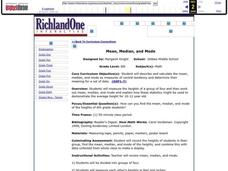
Mean, Median, and Mode
Learners calculate measures of central tendency. in this mean, median, and mode lesson, students calculate the measures of central tendency. They organize data, examine and explain the statistics.
Curated OER
The Ups and Downs of Weight and Mass
Learners explore the concept of mass, and how it differs from weight. They also calculate their weight change as they ride up and down on an elevator. They record the changes in their weight as the elevator moves
graph the collected data.
Curated OER
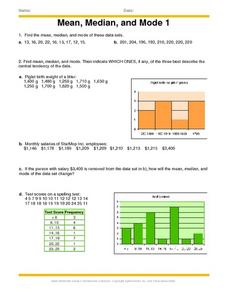
Mean, Median And Mode 1
In this mean, median and mode worksheet, learners problem solve and calculate the answers to ten word problems associated with the mean, median and mode of collected data.
Curated OER
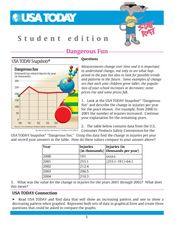
Dangerous Fun
In this line graph learning exercise, students analyze the data on a graph about toy-related injuries by year. Students solve 5 problems in which the change in injuries per year is calculated and recorded on a table.
Curated OER
Weather or Not
Sixth graders explore weather. In this meteorology lesson, 6th graders create weather instruments and compare and contrast weather data.
Curated OER
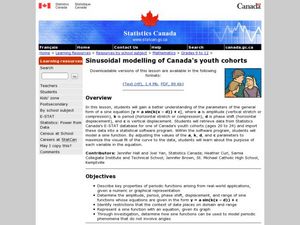
Sinusoidal modelling of Canad'a youth cohorts
Students explore the general form of the sine equation. In this trigonometry instructional activity, students explore the relationship between the changing parameters and the graph of the sine equation. Students use data and a...
Curated OER
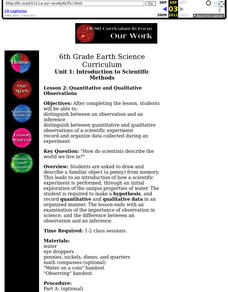
Introduction to Scientific Methods
Sixth graders distinguish between an observation and an inference distinguish between quantitative and qualitative observations of a scientific experiment. They record and organize data collected during an experiment.
Curated OER
Colorado Greats Trading Cards
Students research to find information about famous people from Colorado. They copy and save pictures from the Internet, then make a trading card containing important biographical data.
Curated OER
Hlf-Ball
Students investigate Newton's Laws of Motion and the Law of Conservation of Energy. They examine how a ball and half-ball behave and relate these laws to what happens to the ball. Students produce a graph of the data collected and...
Curated OER
The Cost of Smoking
Students explain the financial and life expectancy costs of smoking using a computer model to enter and adjust parameters to collect data in the form of a table. They analyze the data collected and determine the true cost of smoking.
Curated OER
Mineral Exploration Using Remote Sensing
Students use quantitative data that they gather to figure out where there is an ore body in their model. They describe how geologists could use similar information in order to figure geologic patterns and geologic history for a specific...
Curated OER
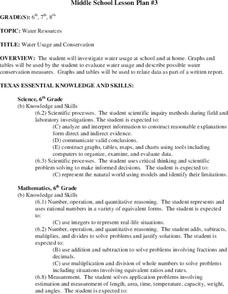
Water Usage and Conservation
Young scholars investigate water usage at school and at home. They use graphs and tables to evaluate water usage. Students describe possible water conservation measures. They use graphs and tables to relate data as part of a written report.
Curated OER
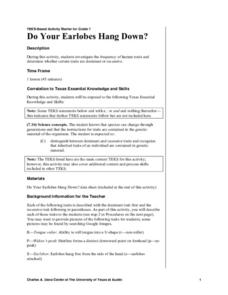
Do Your Earlobes Hang down?
Seventh graders listen as the teacher explains the differences between dominant and recessive traits. The data sheet is described and delivered to students. Students collect data about themselves and record it on their sheet. For the...
Curated OER
Algebra II: Quadratic Functions
Young scholars collect and organize data, make a scatterplot, fit a curve to the appropriate parent function, and interpret the results. Students translate among the various representations of the quadratic function, formulate equations,...
Curated OER
Introducing Linear Terminology
Ninth graders graph linear equations and inequalities in two variables and then, they write equations of lines and find and use the slope and y-intercept
of lines. They use linear equations to model real data and define to define the...
Curated OER
Bird Break Buffet
Students discuss what human traits might help a person be more successful. They discuss how all birds are of the same species but have different beak traits. Students comprehend that the birds that eat the most food will have a baby with...
Curated OER
The Closer I Get To You
Pupils explore the law of reflection. Through experimentation and problem solving, they collect and analyze data pertaining to reflection. The data is plotted on a graph and formulas for calculating the x and y values are evaluated.
Curated OER
The Greenhouse Effect
Seventh graders investigate the temperature change in open and closed containers. In this earth science lesson, 7th graders relate this lab activity to greenhouse effect. They create a line graph from data collected in the experiment.
Curated OER
After Reconstruction: Problems of African Americans in the South
Learners describe issues or problems facing African Americans following Reconstruction. They explain possible solutions to these problems suggested in the sources found and cite arguments for and against those solutions. Analyze primary...
Curated OER
Colored Drops
Learners examine the properties of a liquid that contains water and food coloring and a liquid that contains water, food coloring and a liquid detergent. They interpret their data, describe properties, and make reasonable explanations...
Prairie Public Broadcasting
Egyptian Pyramids Virtual Field Trip!
A virtual field trip takes enthusiastic travelers to the pyramids of Giza. Using Google, scholars explore the grounds of the ancient pyramids found in Egypt then complete three worksheets: a photo analysis page, a reflection sheet, and a...
Curated OER
Mapping Possible Solutions
Fourth graders propose possible sites for the heart of Florida state capital by mapping collected data onto a Florida state map and recording data in a Travel Log.
Curated OER
Half Life Lab
Seventh graders model radioactive decay using pennies, collect data from their model, apply scientific visualization techniques to their data and create animated models explaining the concept of radioactive half-life.


