PBS
Malcolm X: Minister and Civil Rights Activist
Any study of the leaders of the Civil Rights Movement would be incomplete without an examination of the life of Malcolm X. Class members view a short biographical video and analyze primary source documents to gain an understanding of the...
Shodor Education Foundation
Algorithm Discovery with Venn Diagrams
Here is a lesson that takes an interesting approach to analyzing data using box and whisker plots. By using an applet that dynamically generates Venn diagrams, the class forms a strategy/algorithm for guessing the rule that fits the...
Curated OER
The Personal Narrative - Part 3
Let's peer edit! Have your writers exchange their personal narratives with another learner! While peer editing, they will look for any missing information and identify strong details. They can practice literary analysis skills using a...
Student Handouts
Compare and Contrast Chart with Bubble Map
Take your traditional Venn diagrams and mind maps to the next level with this unique bubble map! The graphic organizer allows students to compare and contrast several aspects of two concepts, encouraging a more in-depth analysis overall.
Curated OER
Comparing and Contrasting Yourself to a Character
First and second graders explore character as a story element. They listen to the first part of the story First Day Jitters by Julie Danneberg and observe the teacher modeling a compare and contrast characters activity. Learners listen...
Curated OER
Unit VII Energy: WS 1 Qualitative Analysis - Pie Charts
For each of eight diagrams of objects in motion, physics masters draw pie charts to depict the changes in energy. For each they must identify the energy conditions at each position. This is a unique worksheet, perfect for assessing how...
Curated OER
Sharing My Older Friend With Others
Elementary learners explore the difference between aged characters and young characters in literature. They use Venn diagrams to compare and contrast the attributes given to both younger and older characters in different pieces of...
Curated OER
Building Venn Diagrams
Students use Venn diagrams to solve prime number and factorization problems. In this multiplication lesson, students watch a video and use a Venn Diagram to help them solve a pizza math activity that uses prime factorization. Students...
Curated OER
Answer the Questions Based on the Venn Diagram
In this Venn diagram worksheet, students answer 6 questions about a Venn diagram. Students determine the number of students who like soccer and tennis.
Curated OER
Venn Diagram and UK Basketball
Students analyze data and make inferences. In this algebra lesson, students collect and analyze data as they apply it to the real world.
Curated OER
Seeing in 3D: Interpreting Two-Dimensional Diagrams of Three-Dimensional Objects
Students hone in on their skills at reading diagrams. In this dimensional lesson students collect information on the functions of organs then figure out how all the parts work together.
Curated OER
Organizing Data
In this statistics worksheet, 11th graders collect data and organize it using a frequency table. They plot their data and analyze it using stem and leaf plots. There are 3 questions with an answer key.
Curated OER
Frequency Tables; Discrete Ungrouped Data
In this frequency tables activity, students utilize given data to work out three frequency charts with one containing values and a pie chart involving angles for each value. Students complete three vertical line diagrams and check all...
Curated OER
How Big Is A Humpback Whale?
Students explore humpback whales. In this humpback whale lesson, students determine the actual size of humpback whales and use diagrams to identify the major features of the humpback whale.
Inside Mathematics
Population
Population density, it is not all that it is plotted to be. Pupils analyze a scatter plot of population versus area for some of the states in the US. The class members respond to eight questions about the graph, specific points and...
EngageNY
The Mean as a Balance Point
It's a balancing act! Pupils balance pennies on a ruler to create a physical representation of a dot plot. The scholars then find the distances of the data points from the balance point, the mean.
Concord Consortium
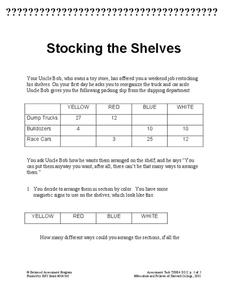
Stocking the Shelves
How many ways can you stock a shelf? It's probably more than you think! Young scholars use data in a frequency table to determine how many ways to stock a shelf given a specific constraint for types of groups. They then repeat the task...
CCSS Math Activities
Smarter Balanced Sample Items: High School Math – Target P
Learn how to show data in varied ways. A PowerPoint presentation provides six questions from the high school SBAC Claim 1 Target P item specifications. It covers creating data representations, interpreting and comparing data, and...
Bowland
Day Out
Use mathematics to help plan a field trip. Scholars use the results of a survey to determine where a class should go on a field trip. They use provided data about entrance fees and mileage to calculate the cost per person of such a trip.
Bowland
Mystery Tours – Plan Your Tour
Everyone loves a vacation and a set of three activities has groups planning a tour of the U.K. using given distance, time, and price data. They solve a variety of problems related to the trip and produce a report on the success of the trip.
Curated OER
Sets an the Venn Diagram
Learners explore the characteristics of sets and Venn Diagrams. Given data, students practice determining the placement of elements in a Venn Diagram. Learners discuss the correspondence between data sets and their graphical...
Curated OER
Using Diagrams in Problem Solutions
Students use tables, graphs and diagrams to collect data. In this problem solving with diagrams lesson plan, students construct their own tables and graphs containing information they gather from a drawing. They also make a Venn Diagram...
Curated OER
Questionnaires and Analysis
Students, review the techniques and different types of data analysis as well as how they are expressed, identify why facts and data are needed in conclusion of a questionnaire. The concepts of qualitative and quantitative data are...
Curated OER
Vertebrate/Invertebrate Venn Diagram
Learners research the characteristics of Vertebrates and Invertebrates. They identify and explain those characteristics. Students create a Venn Diagram comparing/contrasting those characteristics.


