Teach Engineering
Understanding the Air through Data Analysis
Is there a correlation or causation relationship between air pollutants? Groups develop a hypothesis about the daily variation of air pollutants, specifically ozone and CO2. Using Excel to analyze the data, the groups evaluate their...
Balanced Assessment
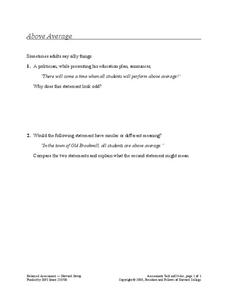
Above Average
Raise the bar and strive to be above average. The assessment task requires budding mathematicians to think critically and evaluate given statements. What does it truly mean to be above average?
West Contra Costa Unified School District
Expository Writing in Math
Pupils engage in an activity where one partner reads directions while the other follows those directions to complete a math task (such as bisecting an angle). As a reflection, they examine products to see what information the best...
TryEngineering
Graphics: Bits and Points
What can a mural teach pupils about computer science? The lesson has scholars create a mural on a wall to learn about bitmap and vector graphics. Along the way, they learn about the graphics coordinate system.
University of Colorado
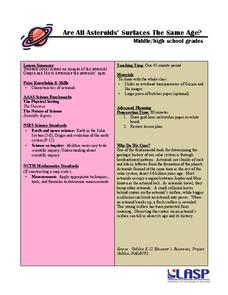
Are All Asteroids' Surfaces the Same Age?
Did you know scientists can tell the age of an asteroid by looking closely at its craters? This final lesson of a six-part series focuses on two asteroids, Gaspra and Ida, in order to demonstrate the concept of dating asteroids. Scholars...
Code.org
Digital Assistant Project
Scholars apply previously learned skills to create a functional computer program. They produce a digital assistant incorporating string commands and complex conditional logic.
Virginia Department of Education
Exponential Modeling
Investigate exponential growth and decay. A set of six activities has pupils collecting and researching data in a variety of situations involving exponential relationships. They model these situations with exponential functions and solve...
Do2Learn
Every Day Activity Picture Cards
Thirty-six picture cards showcase every day activities including sitting, going outside, singing, and more!
Global Oneness Project
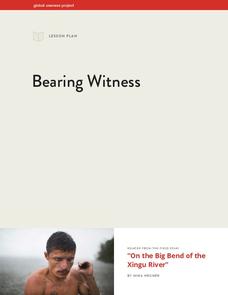
Bearing Witness
A controversial construction project in South America, the Belo Monte dam, is endangering local cultures, ecosystems, and communities. High schoolers create a concept map based on an online article they read before engaging in discussion...
PBL Pathways
Doctors and Nurses
How many nurses does it take to support one doctor? A project-based activity asks learners to analyze state data to answer this question. Classes create polynomial functions from the data of doctors and nurses over a seven-year period....
CK-12 Foundation
Right Triangles, Bearings, and Other Applications: Sailing Race
Help your class get their bearings when it comes to right triangles. Pupils determine distances traveled or components given the bearing of a sailboat using an interactive. The scholars develop a sense of finding the bearings of a given...
CK-12 Foundation
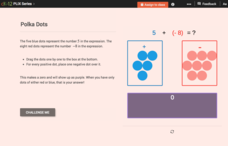
Addition of Integers: Polka Dots
What happens when you add negative and positive integers to one another? Do you add or subtract, and will the answer be positive or negative? Young mathematicians use blue and red polka dots to determine the value of an expression that...
Virginia Department of Education
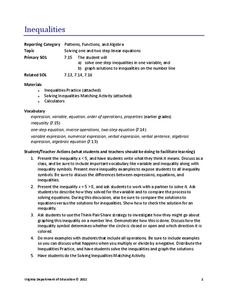
Inequalities
Not all resources are created equal — and your class benefits! Scholars learn how to solve one-step inequalities using inverse operations. They complete an activity matching inequalities to their solutions.
Florida International University
Design Your Own
Apply scientific principles to designing an experiment to study organisms living on the coral reef in our oceans. Through reading, individuals learn about the coral reef ecosystem and important factors that affect its function. Using the...
CK-12 Foundation
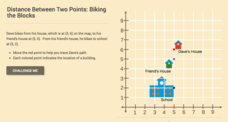
Distance Between Two Points: Biking the Blocks
Distance estimates would be easy if the world were a grid. Scholars work to determine the distance between two structures using a coordinate plane. As an introduction, the lesson focuses on vertical and horizontal distances.
NOAA
A Day in the Life of an Ocean Explorer
What's life like aboard an ocean exploration vessel? Junior oceanographers examine the important role of communication in ocean research in lesson plan two of a five-part series from NOAA. The materials introduce the class to life on...
CK-12 Foundation
Frequency Tables to Organize and Display Data: Favorite Films
What information can your class determine if they know the number of people attending movie showings? Using the information about the number of people at each screening, learners develop a frequency table. The pupils analyze the type of...
CK-12 Foundation
Displaying Categorical Variables: Spending Habits
Bar or circle graph—which is best? Given a circle graph and a total amount of money earned, pupils calculate the amount of money in each category. Learners use the calculated amounts to create a bar graph and compare the two displays.
CK-12 Foundation
Displaying Univariate Data: Ordering Leaves
Leaf a little time to organize data. Given data displayed in a stem-and-leaf plot, learners organize the data in a list. Pupils use the data to determine the mode, median, and range of the data set. They determine the benefits of using a...
CK-12 Foundation
Types of Data Representation: Baby Due Date Histogram
Histograms are likely to give birth to a variety of conclusions. Given the likelihood a woman is to give birth after a certain number of weeks, pupils create a histogram. The scholars use the histogram to analyze the data and answer...
CK-12 Foundation
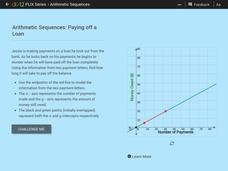
Arithmetic Sequences: Paying of a Loan
How long does it take to pay off a loan? Pupils use a graph to model the sequence associated with paying off a loan. Using the graph, learners determine the initial value and the common difference of the arithmetic sequence. The learners...
Beyond Benign
SLS Toxicology Test
Ingredients in your shampoo are toxic enough to kill plants. The 16th installment of the series of 24 tests the toxicity level of various concentrations of SLS, a chemical found in nearly all shampoo. Learners prepare percent solutions...
CK-12 Foundation
Division of Decimals by Whole Numbers: Lemonade Stand
After a full day of selling lemonade, three friends split the cost of the profit money. If the total profit was $34.20, how much will each friend get?
Cornell University
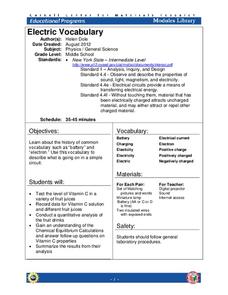
Electric Vocabulary
Practice electric vocabulary using multiple methods. Learners begin by watching a video that explains vocabulary related to electric currents. They match vocabulary cards to practice and then create an electric circuit. Using the...


