Curated OER
Holly Leaves
Sixth graders analyze mathematics by participating in a botany activity. In this holly lesson, 6th graders identify if all holly leaves have the same amount of prickles by conducting a math survey. Students analyze many leaves and...
Curated OER
Representing Data
Second and third graders answer questions based on data presented to them in graphs. They see how to interpret data from a bar graph, line graph, and a chart.
Curated OER
Mean, Variance, and Standard Deviation for the Binomial Distribution
Students review previous lessons on mean, variance, standard deviation, and expected value. They utlize formulas for these characteristics that are specifically designed for the binomial distribution. Students discuss the similarities...
EngageNY
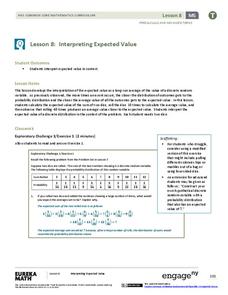
Interpreting Expected Value
Investigate expected value as a long-run average. The eighth installment of a 21-part module has scholars rolling pairs of dice to determine the average sum. They find aggregate data by working in groups and interpret expected value as...
EngageNY
Estimating Probability Distributions Empirically 1
What if you don't have theoretical probabilities with which to create probability distributions? The 11th installment of a 21-part module has scholars collecting data through a survey. The results of the survey provide empirical data to...
Curated OER
Get the Picture!
Astronomers practice downloading data from a high-energy satellite and translate the data into colored or shaded pixels. As a hands-on activity, they use pennies to simulate high-energy satellite data and they convert their penny...
Curated OER
Fibonacci II
Study Fibonacci sequences and see a related set of numbers. Learn and review Lucas numbers and use of quadratic equations to find a general term of a sequence of numbers that is generated by a recurrence relation similar to Fibonacci's.
Curated OER
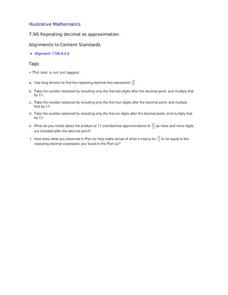
Repeating Decimal as Approximation
You are used to teaching repeating decimals with bar notation that keeps us from writing that number over and over again; now teach what the over and over again represents. This activity allows your mathematicians to explore the infinite...
Curated OER
Latitude
Your young geologists generate a graph given a table of values from the context of latitude and percent of the earth's surface north of that latitude. The questions in the activity then focus the learners to a deeper understanding of the...
Mathematics Assessment Project
Sampling and Estimating: Counting Trees
Your task today: count all the trees on a tree farm. To complete the assignment, learners first estimate the number of trees on a tree farm using random sampling. To improve their own response they then evaluate provided responses to the...
Curated OER
Matrices: A Secret Weapon
Students perform operations with matrices. In this algebra lesson, students use cryptography and cryptanalysis to solve problems. They add, subtract, and multiply matrices.
Curated OER
Shaping Up!
Kindergartners are introduced to basic shapes. Learners spend 45 minutes a day in geometry centers carrying out the activities outlined in this ambitious plan. There are games, hands-on activities, interactive websites, art projects,...
Curated OER
Probabilities using Colored Cubes as Manipulatives
In this statistics worksheet, students model probabilities by using colored cubes to solve word problems. There are 4 questions to solve.
Curated OER
Handling Data: measure of Average
Fifth graders analyze data from a simple table. In this graphing lesson, 5th graders compare distributions. Students recognize that the mean helps them find the formula. Students answer questions on the mean, median, and range.
Insurance Zebra
Insurance Curriculum for Middle and High School Teachers
Liability, deductible, premium ... what do these words mean, and how do they relate to insurance? Scholars complete a pre-test, matching vocabulary activity, and insurance timeline worksheet and become familiar with these terms. Next,...
Curated OER
Cartogram of the Great Compromise
Young scholars create cartograms of populations during 1790.
Curated OER
Quarter Combos
Review money with this motivating lesson. Using a simple game, learners practice adding up coins to total $.25. This lesson comes with worksheets that could be used to cement students' knowledge of this topic.
Curated OER
The Bell Curve
Learners are introduced to the concepts of the normal curve, skewness and the standard deviation. They discuss how the normal distribution has been used and misused to support conclusions.
Curated OER
Graphs and Data
Students investigate poverty using graphs. In this algebra lesson, students collect data on the effects of poverty and use different rules to analyze the data. They graph and use the trapezoid rule to interpret the data.
Shodor Education Foundation
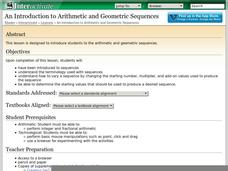
An Introduction to Arithmetic and Geometric Sequences
Help your class look for patterns as they create their own arithmetic and geometric sequences. Engage learners with an introductory discussion on sequences and use the applet to let them explore how sequences are formed. Teachers might...
National Gallery of Canada
Counting Circles
Learners look at bands of colors and estimate how many rings of color there are. While working in groups, they come up with a plan of how to accurately count the rings. They attempt to find a pattern in the colors, and decide whether...
Cornell University
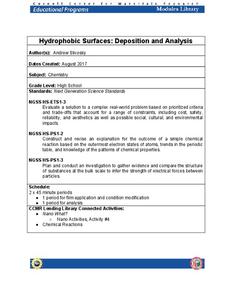
Hydrophobic Surfaces—Deposition and Analysis
Couches, carpets, and even computer keyboards now advertise they are spill-resistant, but what does that mean? Scholars use physical and chemical methods to coat surfaces with thin films to test their hydrophobic properties. Then they...
Curated OER
One, Two, Three...and They're Off
Students make origami frogs to race. After the race they measure the distance raced, collect the data, enter it into a chart. They then find the mean, median, and mode of the data. Next, students enter this data into Excel at which time...
Curated OER
Patterns Here, There, and Everywhere!
Upper graders access the Microsoft Word program and create patterns by utilizing certain keys on the keyboard. They create picket fences, smiley faces, and hearts. It seems that this lesson has as much to do with keyboarding skills as it...
Other popular searches
- Discrete Mathematics
- Discrete Mathematics Graph
- Discrete Mathematics Grade 5
- History Discrete Mathematics
- Discrete Mathematics Lecture
- Discrete Mathematics Trees
- Discrete Mathematics Grade 8
- Discrete Mathematics Graf
- Discrete Mathematics Graft
- Discrete Math Acid Rain
- Discrete Math Lessons
- Math/discrete Math Graphs


