Curated OER
Bycatch
Bycatch is the unwanted and discarded marine life caught during commercial fishing. Young marine scientists review bycatch litigation and analyze graphs of bycatch data and answer questions about it. This raises awareness while...
National Research Center for Career and Technical Education
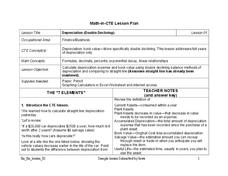
Depreciation (Double Declining)
Have you ever been told that your new car begins to lose its value as soon as you drive it off the lot? Aspiring accountants take on the concepts of depreciation and book value through an easy-to-deliver career and technology...
K20 LEARN
Comparing Numbers And Fruit—More Or Less: Comparing Numbers
A discussion begins a lesson on comparing numbers. Pupils explain how they can show a number, then visit math centers to explore number-making tools. A story read-aloud of More or Less by Stuart Murphy identifies language for comparing...
Curated OER
Ornithology and Real World Science
Double click that mouse because you just found an amazing lesson! This cross-curricular Ornithology lesson incorporates literature, writing, reading informational text, data collection, scientific inquiry, Internet research, art, and...
Curated OER
Graphing and Analyzing Biome Data
Students explore biome data. In this world geography and weather data analysis lesson, students record data about weather conditions in North Carolina, Las Vegas, and Brazil. Students convert Fahrenheit degrees to Celsius degrees and use...
Curated OER
Data Analysis Challenge
In this data analysis worksheet, young scholars work with a partner to collect information for a survey. The information is then compiled into a graph. Young scholars must indicate their survey question, the target audience, predict the...
Illustrative Mathematics
Walk-a-thon 1
Your mathematician's job is to explore the relationship between hours and miles walked during a walk-a-thon. The activity compels your learners to experiment with different means in finding out this proportional relationship. The answer...
Saxon
Plotting Functions
Youngsters use a graphing calculator to assist in creating a function table. They graph the function on a coordinate plane. They explore the relationship between the domain and range in the graph. This four-page worksheet contains two...
Curated OER
Reading Graphs
Learners read graphs and charts to interpret results. In this algebra activity, students interpret bar, line and pictographs. They draw conclusions and make predicitons based on these charts.
Curated OER
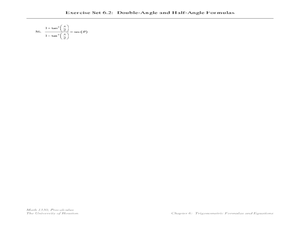
Double-Angle and Half-Angle Formulas
In this college level Pre-Calculus worksheet, learners use the double-angle and half-angle formulas to evaluate trigonometric expressions and solve trigonometric equations. The six page worksheet contains fifty-six problems. Answers are...
Curated OER
Transformations And Animations in Polar Graphing
In this math worksheet, they investigate the polar graph of: r = a + b sin (t), for various values of a and b. This is called a limacon and is applied to the definition of a transformation.
Curated OER
Mean, Median, and Mode
Fourth graders compare two sets of data by using a double bar graph. In this data analysis lesson plan, 4th graders study a double bar graph and complete questions based upon the data. Students construct a table to show the data from the...
Curated OER
Human Population Growth
In this human population growth worksheet, students create a graph of human population growth and predict future growth using the data given in a chart. Students identify factors that affect population growth.
Curated OER
Pizza, Pizza
Students survey community members to determine their favorite pizza toppings and create a bar graph to show their findings. In this probability and statistics instructional activity, students collect data by conducting a survey. They...
Curated OER
Dealing with Data
Seventh graders collect and analyze data. In the seventh grade data analysis lesson, 7th graders explore and/or create frequency tables, multiple bar graphs, circle graphs, pictographs, histograms, line plots, stem and leaf plots, and...
Concord Consortium
Rule of 72
Find an easier way to double it. Using the price of an item and the Consumer Price Index, learners determine how long it will be for the price to double. Scholars calculate the length of time it would take for the price to double using a...
Mathematics Assessment Project
Classifying Solutions to Systems of Equations
Double the fun of solving a linear equation with an activity that asks learners to first compete an assessment task graphing two linear equations to find the common solution. They then complete a card activity solving systems of...
Curated OER
Double Data
In this data instructional activity, students answer 4 questions about a double line graph. For example, "How can you use the graph to figure out when each alligator grew the most?"
Curated OER
Usage and Interpretation of Graphs
Students review graphing and use processing skills to solve problems.
Curated OER
Pictograph to Bar Graph
Second graders explore organizing data to make it useful for interpreting picture graphs and bar graphs. They use Graphers software to create a pictograph and a bar graph.
Curated OER
Pet Count Excel Graphing
Pupils used collected data to distinguish what pets they have or would like to have. They correlate findings with appropriate technology--Excel. At the end of the lesson plan they tabulate a bar chart and present their findings to the...
Math Moves U
Collecting and Working with Data
Add to your collection of math resources with this extensive series of data analysis worksheets. Whether your teaching how to use frequency tables and tally charts to collect and organize data, or introducing young mathematicians to pie...
US Department of Commerce
Changes in My State
So much can change in seven years. Young statisticians choose three types of businesses, such as toy stores and amusement parks, and use census data to determine how the number of those businesses in their state changed between 2010 to...
EngageNY
Finding One Hundred Percent Given Another Percent
Class members solve problems to find the whole when given a percent. They use double line numbers and factors of hundred to help break the 100 percent into equal segments.
Other popular searches
- Double Bar Graph Activities
- Reading Double Bar Graphs
- Reading Double Line Graphs
- Double Bar Graph Assessment
- Creating Double Bar Graphs
- Definition Double Bar Graph
- Double Bar Graph Worksheets
- Double Bar Graphs Ell
- Double Bar Graphs Animals
- Double Bar Graphs Enrichment
- Double Bar Graphs Reteach
- Double Bar Graphs Worksheets


