Curated OER
Exponential and Exponents Functions
Students solve problems using exponential properties. For this algebra lesson, students differentiate between exponents, exponential and log functions. They graph their functions using table and exponents.
Curated OER
The Mister Runtles' Bet
Students listen to a story dealing with exponential and linear growth. After reading the story, students complete a table comparing information. Using a calculator, students graph the rice and daily population of flies. They study the...
Curated OER
Graphing at all Levels: It's a Beautiful Thing!
Mixing math and art is done in this lesson by applying graphing knowledge to create a unique piece of art. This lesson varies acording to the graphing knowledge of the artist. First, learners identify and review various types of graphing...
National Research Center for Career and Technical Education
Safety and Sanitation
Your microbiologists explore the graphing of exponential growth functions using bacteria, like e. coli and salmonella, in a well-written, career and technology lesson.
Mathematics Vision Project
Quadratic Functions
Inquiry-based learning and investigations form the basis of a deep understanding of quadratic functions in a very thorough unit plan. Learners develop recursive and closed methods for representing real-life situations, then apply these...
Illustrative Mathematics
Modeling London's Population
Looking at London's population from 1801–1961 in 20 year increments, high school mathematicians determine if the data can be modeled by a given logistic growth equation. They explain their thinking and determine the values of each...
Curated OER
Algebra 1: Unit 5 Review
In this problem solving learning exercise, 6th graders determine if 4 functions are exponential growth or decay, sketch 4 graphs and compare 2 sets of functions. Students write the rule, linear or exponential, for 4 tables.
Mathematics Vision Project
Module 1: Sequences
Sequences are all about recognizing patterns. A module of 11 lessons builds pupils' understanding of sequences through pattern analysis. The practice connects the analysis to linear and exponential equations. This is the first module in...
CCSS Math Activities
Smarter Balanced Sample Items: High School Math – Target M
Your knowledge of graphs is a function of how much you try. Young mathematicians work on a set of 12 questions that covers graphing functions, comparing functions, and rewriting functions in different forms to determine key features....
Curated OER
More of U.S.
Explore graphical representation of a real-life data set and determine the exponential regression model for the data in your classroom. Students also compare the estimated value to the given value by determining the percent error.
Curated OER
Filling Empty Pockets: Borrowing, Loans, and Credit
High schoolers examine credit components and how each works within our economy today. In this financial literacy instructional activity, students explore credit terms and make decisions based on real credit card offers that they find in...
Curated OER
Skeeter Populations and Exponential Growth
Middle schoolers perform investigations on the growth of populations and use exponential functions to represent that growth. They watch a video clip of growth patterns. Students work in groups to determine the "population" of each color...
Texas Instruments
Buying Your First New Car!
Learners explore exponential growth and decay using M&M’s in this Algebra II/Pre-calculus lesson plan. They investigate the cost of a new car by calculating depreciation and payments.
Curated OER
Comparing Investments
Money, money, money. A complete activity that makes use of different representations of simple and compound interest, including written scenarios, tables, graphs, and equations to highlight similarities and differences between linear and...
Curated OER
WORLD POPULATION STUDY
Students explore an exponential relationship and how it relates to human population growth and the current global population crisis.
Illustrative Mathematics
Lake Algae
Introduce learners to exponential growth with this real-world problem about algae that is rapidly spreading across a lake in a city park. The task presents the rate of growth and an end value and asks learners to determine what happened...
Curated OER
Population Biology Case Study
Students are focused on the big question: What makes a population grow and how could that growth stop? They use these concepts to help answer the big question: carry capacity, density dependent v. density, independent factors, predation...
Curated OER
Will Exams Be Cancelled?
If the flu outbreak continues, exams will have to be canceled. Investigate the properties of exponential and logarithmic functions. In this algebra lesson, students use the TI to examine and differentiate between exponential growth and...
Curated OER
How popular is your favorite site?
Students gather data for the project for the entire year. They plot their data, try to fit a equation to their data, and speculate on why the data shows the pattern it does and project its future growth.
Curated OER
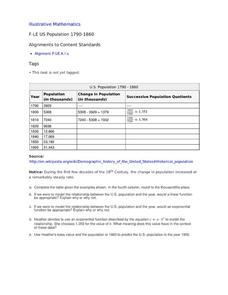
US Population 1790-1860
Your young population scientists analyze a table of values, write a model to represent the real life data, finish the table of data and predict future populations in a collaborative, real-life activity.
Curated OER
Means of Growth
Students collect and graph data. In this statistics lesson, students analyze their plotted data using a scatter plot. They identify lines as having positive, negative or no correlation.
Mathematics Assessment Project
College and Career Readiness Mathematics Test A2
A six-page evaluation covers material included in algebra, geometry, and algebra II. Applied word problems are mixed in with short answer questions. It also provides questions on mathematical reasoning.
Mathematics Assessment Project
College and Career Readiness Mathematics Test C1
Challenge high schoolers with a thorough math resource. The 20-page test incorporates questions from upper-level high school math in applied and higher order questions.
Curated OER
Reciprocals of Quadratic Functions
Eleventh graders investigate inverse functions. In this Algebra II lesson, 11th graders use their prior knowledge of linear, exponential,and quadratic functions to create a graph of an equation they have never seen before.


