Curated OER
Food Groups in our Lunch
Young scholars make a graph. In this food groups and graphing instructional activity, students pack a sack lunch and then work in groups to tally the number of foods from each food group that they have. Young scholars use the data...
Curated OER
Did You Eat That! - Food Graph
For this health and diet instructional activity, students ask ten of their friends what their favorite vegetables are. Then they tally their votes and shade them in on the graph provided.
Curated OER
Are We Eating a Healthy Diet?
In this diet and health worksheet, students fill in a tally sheet of food groups that they have eaten. They total the tallies to determine whether they are eating a healthy diet.
Curated OER
Graphing
Intended for a faith-based classroom, this lesson requires second graders to create a survey, conduct the survey in multiple classrooms, and graph the results. They can choose between creating a picture or bar graph, or you can require...
Curated OER
Competing For Food
Students examine the hunting and gathering aspects of the Washoe culture. They are assigned roles, and participate in a simulation of surviving through the seasons by competing for food with other people and tribes.
Curated OER
Favorite Food Survey Recording Sheet
In this favorite food survey recording worksheet, students use the survey sheet to collect data about favorite foods. They fill in the name and favorite food of the people they survey.
Chicago Botanic Garden
Calculating Your Carbon Footprint
Unplugging from technology for one day per week will decrease your carbon footprint—are you up to the challenge? Part two in a series of three allows individuals to explore their personal carbon footprints. By first taking a quiz at home...
Curated OER
Data From Interviews
Students create and conduct a survey about favorite foods, gather and represent the data, interpret data and make predictions to present to the class. They create and use interview questions to gather data. Pupils are explained that...
Curated OER
Let's Talk Trash
In this solid waste worksheet, students classify the different types of solid wastes found in landfills into given categories. Students predict and tally the total number of each type of item found in the landfill using slips of paper....
Curated OER
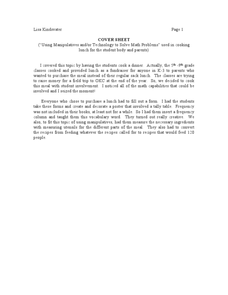
"Using Manipulatives and/or Technology to Solve Math Problems" by Cooking Dinner
Students explore math functions by preparing a meal. In this food measurement lesson, students examine a recipe for a meal and alter the size of the recipe based upon the amount of servings needed. Students utilize manipulatives to...
Curated OER
Voting
Second graders discuss with the class their favorite Thanksgiving foods. The teacher will write responses from four students on the board and the students then will vote for their favorite Thanksgiving food on a folded sheet of paper....
Curated OER
Foodborne Illness Outbreak Investigation
Learners demonstrate how epidemiological investigations of outbreaks are performed. They illustrate the principles of hypothesis formation and testing by epidemiologic study in the setting of an acute foodborne disease outbreak.
NOAA
What's the Difference?
Due to the isolation of seamounts, their biodiversity offers a great deal of information on the development of biological and physical processes. Pupils use simple cluster analysis to rate the similarity and differences in biological...
Curated OER
Annual Wetland Plant Diversity Survey
High schoolers locate an area of marsh and, by measuring the total number of individual plants in a sample area, determine whether purple loosestrife population density is correlated to the total plant diversity of the community. They...
Curated OER
Taking Account of Water
Students discover how much water they actually use and investigate the need for water conservation.
Curated OER
How Trashy Are You?
Students determine the amount of trash a teenager produces. In this environmental lesson, students use a garbage bag to collect trash during a twenty-four hour period. Students weigh their bags at the end of the twenty-four hours.
Curated OER
A Day at the Beach-Why Did We Do It?
Students investigate pollution at the beach. In this environmental lesson, students participate in a beach clean-up and calculate the weight of the debris collected. Students write a reflection in their journal about their beach clean-up...
Curated OER
Cleaning Up
Young scholars demonstrate how to be a philanthropist. In this philanthropy lesson plan, students read the story The Wartville Wizard and discuss ways to become a philanthropist. Young scholars participate in a good deed by volunteering...
Curated OER
Culture and Obesity
Students explore cultural perceptions regarding obesity. In this personal health lesson, students read case scenarios about 3 women and their health perceptions. Students discuss the women and the stereotypes associated with the women...
Curated OER
Maps and Lines
In these organizing data worksheets, 5th graders complete four worksheets of activities that help them learn maps, graphs, and lines. Students then study images of maps, lines, and graphs.
Curated OER
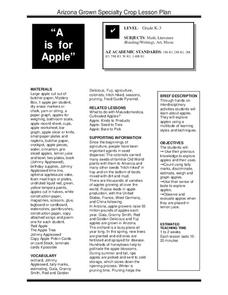
A is for Apple
Students participate in a variety of activities to learn about apples. Students graph apples, learn about apple uses, taste apples, and observe what happens when apples are dipped in lemon juice.
Curated OER
Delicious Graphing
Fourth graders sort trail mix by type and use that information to create different types of graphs for comparing.


