Curated OER
Photographical Ecology
Middle schoolers study organisms and the roles they play in nature. In this ecology lesson, students photograph several examples of organisms during a nature walk. Middle schoolers print out their photos and classify the organisms as...
Curated OER
How can my breakfast help the birds?
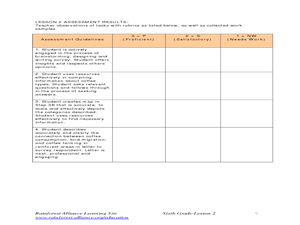
Sixth graders design farms with a bird's habitat in mind. In this farm lesson plan, 6th graders research how sun grown coffee destroys a bird habitat, and then they make their own farm with a bird's habitat being preserved. They then...
Curated OER
Not Just a Bag of Beans
Young scholars determine the types of natural selection and variation that exists in a population, using beans.
Curated OER
Do the Elephants Need Sunscreen? A Study of the Weather Patterns in Etosha
Students analyze the weather patterns in Namibia. They create a graph of the yearly temperatures and use the internet to gather information. They discuss how the weather goes in cycles in the area.
Curated OER
Mother May I?
Third graders measure distance using nonstandard units of measure. In this measurement lesson, 3rd graders measure a given distance through the use of the game "Mother May I?" Student gather and compare data on how many "giant steps" and...
Curated OER
Comparison of Snow Cover on Different Continents
Students use the Live Access Server (LAS) to form maps and a numerical text file of snow cover for each continent on a particular date. They analyze the data for each map and corresponding text file to determine an estimate of snow cover...
Curated OER
Aruba Cloud Cover Measured by Satellite
Students analyze cloud cover and to compose written conclusions to a given related scenario. They submit a letter of response and a report detailing their calculations and conclusions.
Curated OER
Integrated Algebra Practice: Box and Whisker Plots
In this box and whisker plot worksheet, students solve 5 short answer problems. Students use box and whisker plots to describe data and determine what percentile a piece of data belongs.
Pennsylvania Department of Education
Equally Likely and Unequally Likely Outcomes
Students explore probability. In this statistics/probability lesson, students compare experimental and theoretical probability and use experimental probability to make predictions and conjectures. Students explore the distinction...
Curated OER
Tune...Um!
Students collect real data on sound. In this algebra lesson, students use a CBL and graphing calculator to observe the graph created by sound waves. They draw conclusion about the frequency of sound from the graph.
Curated OER
Whose Breakfast isn't for the Birds?
Students explore coffee production. In this cross-curriculum rainforest ecology instructional activity, students research regions where coffee comes from and investigate how the native birds in the rainforest are effected by coffee...
Curated OER
Zoo Favorites
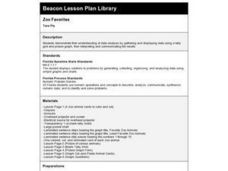
First graders construct a class picture graph and tally grid that show their favorite zoo animals. They discuss the information the graphs show and complete a personal graph based on the class example.
Curated OER
Childhood Obesity
Students identify a question to generate appropriate data and predict results. They distinguish between a total population and a sample and use a variety of methods to collect and record data. Students create classifications and ranges...
Curated OER
Snow Cover By Latitude
Students examine computerized data maps in order to create graphs of the amount of snowfall found at certain latitudes by date. Then they compare the graphs and the data they represent. Students present an analysis of the graphs.
Curated OER
Flame Test
Young scholars conduct a flame test on different substances. In this chemistry lesson, students predict the element present based on the color emitted during the flame test. They explain how different elements produce different colors.


