Code.org
Sending Numbers
Binary graphing ... bit by bit. Pairs work together to develop a protocol in order to send the points of a graph. One partner sends the points and the other receives them and tries to recreate the graph. The pupils use the rubric to...
Charleston School District
Sketching a Piecewise Function
How do you combine linear and nonlinear functions? You piece them together! The lesson begins by analyzing given linear piecewise functions and then introduces nonlinear parts. Then the process is reversed to create graphs from given...
EngageNY
Polynomial, Rational, and Radical Relationships
This assessment pair goes way beyond simple graphing, factoring and solving polynomial equations, really forcing learners to investigate the math ideas behind the calculations. Short and to-the-point questions build on one another,...
EngageNY
Four Interesting Transformations of Functions (Part 1)
Understanding how functions transform is a key concept in mathematics. This introductory instructional activity makes a strong connection between the function, table, and graph when exploring transformations. While the resource uses...
West Contra Costa Unified School District
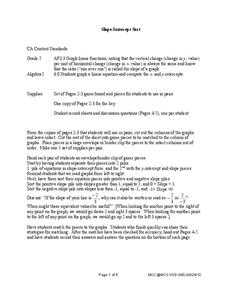
Slope-Intercept Sort
What's so special about slope? Pupils first match cards with slope and y-intercept to graphs of linear equations. They continue the lesson by matching equations in slope-intercept form to the same graphs.
Balanced Assessment
On Averages and Curves
Determine the average on a curve. The class finds graphical representations of averages and expresses them both symbolically and on the graph. The assessment requires class members to justify using average to describe graphs.
National Security Agency
What’s Your Coordinate?
Your middle schoolers will show what they know with their bodies when they become the coordinate plane in this conceptual development unit. Starting with the characteristics of the coordinate plane, learners develop their skills by...
EngageNY
Comparing Integers and Other Rational Numbers
The ninth installment of a 21-part module has pupils compare integers and rational numbers in decimal and fraction form. They match stories to number lines and compare values in the stories.
EngageNY
Making Scale Drawings Using the Parallel Method
How many ways can you create a dilation? Many! Individuals strengthen their understanding of dilations by using various methods to create them. The new technique builds on pupils' understanding of the ratio method. Using the ratio,...
Math Learning Center
Fifth Grade Assessments and Scoring Checklists, Common Core State Standards
Check for understanding with a set of math assessments. Fifth graders answer questions involving multiplication and division, median and mode, rotational symmetry, and graphing.
Royal Baloo
Star Wars K-2nd Math Pack
Included in a Star Wars themed packet, young padawans enhance mathematical skills such as graphing, computing using basic operations, counting numbers and money, telling time, and measuring. Scholars play a game of sudoku, read number...
Chemistry Collective
Virtual Lab: Determination of the pH Scale by the Method of Successive Dilutions
Where did the pH scale come from? Take a deeper look at a most important measure of ion concentration using a simulated physical determination. Young chemists prepare a series of dilutions after determining a dilution factor for the...
Illustrative Mathematics
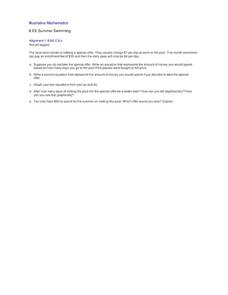
Summer Swimming
Here is a real-world application for systems of equations. When is it better to pay an enrollment fee and lower daily rate, and when is it better to pay the regular price? The local swim center is having a special offer, reductions in...
Illustrative Mathematics
Fishing Adventures 2
This resource is part of a series which expects participants to be familiar with graphing inequalities on a number line. It is a word problem that asks your class to graph a discrete solution set and interpret it in the context of an...
Illustrative Mathematics
Buying Bananas, Assessment Version
Practice with unit rates, proportions, and ratios when Carlos purchases an amount of bananas. Learners must interpret a graph to decide whether points on the same line represent similar proportional relationships. Use with lesson plans...
US Environmental Protection Agency
Weather and Climate: What's the Difference?
Future weather forecasters collect daily temperatures over a period of time. Afterward, they compare their data with monthly averages, as researched on national weather websites, in order to grasp the difference between weather and...
University of California
Seasons Lab Book
Unlock the mystery behind seasonal change with a collection of worksheets and activities. Whether they are drawing pictures of Earth's orbit around the sun or graphing the temperature and daylight hours of different locations from around...
EngageNY
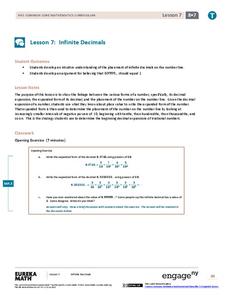
Infinite Decimals
Can you support the argument that the decimal 0.99999 ... is equivalent to the number one? The seventh installment in this 25-part module gives convincing support for this conclusion. Pupils write infinite decimals using powers of 10....
Flipped Math
Correlation
Determine how close the line is to the scatter plot. Clear video instruction shows how to plot a scatter plot and find the best fit line using the linear regression function on a calculator. Pupils use the information from the calculator...
Curated OER
Changing Planet: Sea Levels Rising
Begin by showing a six-minute video, Changing Planet: Rising Sea Level as an anticipatory set. Pupils draw a topographic map of a potato continent. Finally, they will visit NOAA's sea levels online map and NASA's carbon dioxide...
Baylor College
Global Atmospheric Change: The Math Link
Change up the classroom atmosphere with this interdisciplinary resource. Following along with the children's book Mr. Slaptail's Curious Contraption, these math worksheets provide practice with a wide range of topics including simple...
CPO Science
Science Worksheets
If you need an array of worksheets to augment your science lessons, peruse a collection of assignments that is sure to fit your needs. With topics such as metric conversion, the scientific method, textbook features, research skills,...
CK-12 Foundation
Irwin and Ruthie
Learners compare acceleration to displacement through an interactive tutorial that permits them to adjust the running strategy of two robots and watch them race. A graph displays the robot's velocity over time and another shows their...
CK-12 Foundation
Derivatives of Trigonometric Functions: Derivative of sin(x)
Graphically find the derivative of sin(x). Using the interactive, pupils graph the slope of the tangent line to the sine function. Class members use the resulting graph to determine the derivative of the sine function. They verify their...
Other popular searches
- Graphing Linear Equations
- Graphing Linear Inequalities
- Graphing Lines
- Graphing Linear Functions
- Linear Patterns Graphing
- Graphing Linear Systems
- Line Graphing Activity
- Line Graphing Data
- Line Graphing
- Graphing a Linear Equation
- Linear Graphing
- Graphing Nonlinear Functions


