Curated OER
Graphing Linear Motion
In this graphing linear motion worksheet, students answer 20 questions about velocity of objects, the distance they travel and the time. They interpret a graph of position vs. time and identify the velocity at certain point on the graph.
Curated OER
Graphing Calculator Investigation - Second Degree Polynomial Functions
Students solve quadratic functions. In this solving quadratic functions instructional activity, students determine the height of an object at a given time. Students determine the time at which an object hits the ground. Students answer...
Curated OER
Intercepting Villans Using the Correct Rate
A Cyberchase video introduces the distance = rate x time equation. Participants then calculate answers to proposed problems and graph a series of results that is then incorporated into a game to help cement the concept. A thorough and...
Curated OER
Functions and Graphing
Graphing functions in a real world application makes math come to life. Learners graph points on a coordinate plane and identify various points on a graph by working through a set of real world problems. This is a perfect review exercise.
Illustrative Mathematics
Bike Race
A graph not only tells us who won the bike race, but also what happened during the race. Use this resource to help learners understand graphs. The commentary suggests waiting until the end of the year to introduce this topic, but why...
Curated OER
Speed
Fifth and sixth graders practice working in pairs to determine whether they can walk with constant speed. They test themselves, collect their data, draw graphs with their data collected, manipulate the data, and then draw conclusions...
EngageNY
Comparing Linear Functions and Graphs
How can you compare linear functions? The seventh installment of a 12-part module teaches learners how to compare linear functions whose representations are given in different ways. They use real-world functions and interpret features in...
NASA
Newton Car
If a car gets heavier, it goes farther? By running an activity several times, teams experience Newton's Second Law of Motion. The teams vary the amount of weight they catapult off a wooden block car and record the distance the car...
Bowland
Mystery Tours – Plan Your Tour
Everyone loves a vacation and a set of three activities has groups planning a tour of the U.K. using given distance, time, and price data. They solve a variety of problems related to the trip and produce a report on the success of the trip.
Curated OER
Graphing of Time and Distance
In this graphing time and distance worksheet, students graph data of a two race cars as they drive over time. Students plot the time vs. the distance for both cars and answer questions about the data. They determine the speed of the cars...
Curated OER
Comparing Distance/Time Graphs to Speed/Time Graphs
In this graphing the motion of objects learning exercise, students compare graphs of distance vs. time and speed vs. time of objects moving at constant speed, accelerating, slowing down, and stopped. Students identify the movement of a...
Curated OER
The Barbie Bungee Drop
What do math, bungee jumping, and Barbie® have in common? Young adventure seekers use rubber bands as bungee cords to predict a thrilling, but safe, jump for their doll. First, test jumps are conducted with a few rubber bands. Then more...
Curated OER
Busted Bubbles
Using the scientific method, and bubble gum, learners conduct a motivating experiment. After conducting a series of tests involving bubble gum, they graph and analyze their results. This is the type of activity everyone loves.
Curated OER
Now That's Using Your Head!
Explore linear measurement. Scholars will measure the circumference of their head and the distance they can jump. Information is recorded, averages are calculated, and a data table is completed. They then determine possible relationships...
Curated OER
Barbie Bungee
Middle and high schoolers collect and analyze their data. In this statistics lesson, pupils analyze graphs for linear regression as they discuss the relationship of the function to the number of rubber bands and the distance of the...
Utah Education Network (UEN)
The Human Line Plot
Learners collect data and use charts and line plots to graph the data. Some excellent worksheets and activities are embedded in this fine lesson on line plots.
Curated OER
Graphing Your Motion with Vernier LabQuests
Seventh graders create motion graphs using a motion sensor. In this physics lesson, 7th graders match the graph shown by moving their body. They relate the slope to the way they moved.
Inside Mathematics
Squares and Circles
It's all about lines when going around. Pupils graph the relationship between the length of a side of a square and its perimeter. Class members explain the origin in context of the side length and perimeter. They compare the graph to the...
Illustrative Mathematics
Distance across the channel
Here you will find a model of a linear relationship between two quantities, the water depth of a channel and the distance across the channel at water level. The cross section of the channel is the shape of an isosceles trapezoid. The...
EngageNY
Graphs of Piecewise Linear Functions
Everybody loves video day! Grab your class's attention with this well-designed and engaging resource about graphing. The video introduces a scenario that will be graphed with a piecewise function, then makes a connection to domain...
Utah Education Network (UEN)
Linear Graphs Using Proportions and Rates
Using a TI-73 or other similar graphing calculator middle school math majors investigate the linear relationship of equivalent proportions. After a brief introduction by the teacher, class members participate in a timed pair share...
Messenger Education
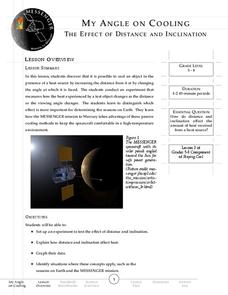
My Angle on Cooling—Effect of Distance and Inclination
When exploring Mars, spacecrafts are exposed to 5-11 times more sunlight than when near Earth. Groups of pupils complete a hands-on activity to explore how distance and angle of the sun affect temperature. Through discussions, they then...
Curated OER
Exploring Quadratic Data with Transformation Graphing
Using a data collection device to collect data regarding a bouncing ball, students use various features on graphing calculators to experiment with the parameters of the vertex form of the parabola and their effect on the shape of the...
Curated OER
Chart Your Course
Middle schoolers explore change represented in graphs comparing distance and time. They exchange and share their graphs. Students interpret and create distance versus time line-graphs, and write stories based on these graphs. They...


