CK-12 Foundation
Vertical Translations
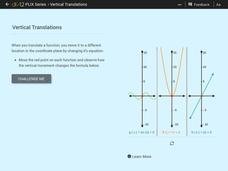
Change the y-intercept by adding a constant to the function. Individuals move three functions vertically along the y-axis. As they observe how the equation of the functions change with the vertical movement, learners determine how to...
College Board
2006 AP® Statistics Free-Response Questions
Catapult the class into the test. Released items from the free-response section of the 2006 AP® Statistics exam ask individuals to use statistics to figure out the best catapult for determining the accuracy of thermometers. The six...
Curated OER
Polynomials Functions
High schoolers factor polynomials and linear functions and apply concepts of the fundamental theorem of algebra to solve problems. They graph their solutions and analyze the graph.
Curated OER
Scatter Diagrams and Curve Fitting
In this Scatter Diagrams and Curve Fitting worksheet, students are guided in how to graph a scatter diagram (plot) and a Best Fit Line using a TI-83 graphing calculator.
Curated OER
Maximize It!
Students design a rectangular box without a lid that has the largest possible volume using the supplied sheet of centimeter graph paper. They work in groups to construct different size boxes to determine the largest possible volume and...
Curated OER
The Way to Better Grades!
Pupils collect and analyze data. In this statistics lesson, learners create a scatter plot from their collected data. They use, tables and graphs to analyze the data and mae decisions.
Curated OER
Algebraic Relationships
Here are 17 various forms of problems that range from matching equivalent expressions to word problems. Included are problems for substutiing values into expressions and using the order of operations, simplifying algebraic expressions,...
Curated OER
Introduction To Quadratics
Students explore the concept of quadratic functions and review how to solve and graph linear functions. They play a game for reviewing linear functions to stay engaged in the lesson and then plot and graph a multitude of different...
Curated OER
Solutions, Solutions, Could it Be?
Students graph and solve linear system of equations. In this algebra activity, students use algebraic and graphing methods to solve their systems. They find the point of intersection for their solution and draw inference from their data.
Curated OER
Graphing Absolute value Inequalities
Students investigate the concept of inequalities and practice graphing them at various degrees of difficulty. They review the basic rules with the teacher at the level of theory which may make it harder for them to understand without...
Curated OER
x- and y-Intercepts
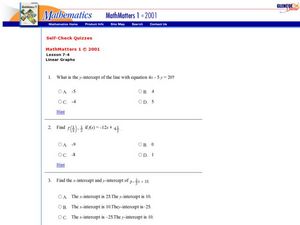
In this x- and y-intercepts worksheet, 9th graders solve and graph different problems related to linear equations. First, they determine the x- and y-intercepts by plugging in 0 for each and solving. Then, students find at least one more...
Texas Instruments
TI-Nspire™ CAS
When it comes to rating educational calculators, this calculator is always near the top of this list. Now it's available as an app. There is a lot of calculator power wrapped up in this app. Not only is this a fully functioning...
Texas Instruments
TI-Nspire™
We landed on the moon with less computing capabilities than you can find in this app! Here is a multiple function calculator that takes all the power you get from a handheld and adds the wonderful large screen that only a tablet can...
Curated OER
Slope
Students calculate the slope of a line. In this slope lesson, students use a graph, an equation or two points to help them calculate the slope of a line. They differentiate between a slope of zero and an undefined slope.
Curated OER
Slope, slope-Intercept Form and Standard Form
Students investigate and solve linear equations using slopes. In this algebra instructional activity, students graph lines using the slope and y intercept. They also find the slope by rewriting their equation in to slope-intercept form...
Curated OER
Eliminate What?
Students are introduced to the elimination method in Algebra. As a class, they solve two linear equations with two unknowns using this new method. They discuss the positive and negative aspects of using this method to solve problems. ...
Curated OER
Make a Pass at Me
Students identify different types of functions and units of measurements. In this statistics lesson plan, students will collect data, graph their data and make predictions about their data. They plot a linear regression graph.
Curated OER
Cramer's Rule ID: 8793
Mathematicians are introduced to Cramer’s Rule and use it to solve three systems that have one solution, no solutions, and an infinite number of solutions. Young scholars use TI-Nspire to graph the systems to verify their answers and...
Curated OER
A Point of Intersection
Students factor and solve systems of equation. In this algebra lesson plan, students identify the point of intersection using substitution, elimination and graphing. They write an equation given a system and a graph.
Curated OER
Whose Line is it Anyway?
Students solve systems of equations. In this algebra lesson, students identify the domain and range of each function. They use the slope and y-intercept to graph each line.
Curated OER
Linear Functions: Are You Ready for the REAL World?
students emulate a real world problem and model it with mathematics working in a small group. Observe and facilitate discussion as the groups use various strategies, such as (graphs, brainstorming, tables, and dialogue.
Curated OER
Walking on Air
Students collect and analyze data with a graph. In this statistics lesson, students use central tendencies to find the meaning of their data. They display the data on a Ti calculator.
Curated OER
Round and Round and Round We Go!
Students investigate motion using a CBL. In this algebra lesson, students collect and graph data on a coordinate plane. They define and identify amplitude and period of conic graphs.
Curated OER
Graphing Equations
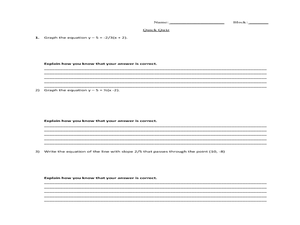
Students differentiate between linear and quadratic functions. In this algebra lesson, students write equations of graphs and graph a function from an equation. They also identify the slope and y-intercept.
Other popular searches
- Algebra Graphing Lines
- Graphing Lines Quilt Pattern
- Linear Equations and Graphing
- Linear Equations Graphing
- Pre Algebra Graphing Lines
- Area Graphing Lines
- Ged Graphing Lines


