Curated OER
Exploring the Beach
Students explore the beach. In this marine habitat lesson plan, students inspect sand grains, design beach profiles, classify marine life, and examine natural beach habitats. Students use spreadsheets to record data from their activities...
Curated OER
Pump It Up
Students study the anatomy and functions of a heart. In this heart study lesson, students read a book about the heart and study a plaster heart model. Students take their own pulse in various stages of rest as well as active...
Curated OER
Preventing Forest Fires (Elementary)
Learners complete activities to learn about the importance of fire prevention and protecting the diversity of the forest. In this forest protection activity, students discuss forest fires and work in groups to research the species count...
Curated OER
Oh Deer!
Students discuss the components necessary to keep animal populations alive . Then they participate in a game where they interact as deer, food, water, and shelter. The activity demonstrates that nature is not static, but changes with the...
Curated OER
When Push Comes to Crunch
Eighth graders engage in an experiment which uses an inclined plane and balls of various masses to determine the effect a large object has on a small object. They study velocity, momentum, gravity and forces.
Curated OER
An Introduction to Computer Components
Students experience the first lesson in computer servicing by observing computer components. They observe the internal workings of a computer during the lecture section of the lesson before dismantling a computer to identify its major...
Curated OER
Discovering the Problem of Solid Waste
Students catagorize the types of garbage from going through a trash can provided by their teacher. They then chart the items on a graph and propose a solution to reduce the amount of garbage.
Curated OER
Rate of Cooling Experiment
Ninth graders measure the insulation properties of different fabrics by immersing cans of water covered with fabric "socks" in an ice bath and measuring temperature changes. They then calculate heat loss and graph the data individually.
Curated OER
Forces and Motion-The Downhill Racer
Students calculate a toy car's velocity and acceleration. In this force and motion lesson, students build ramps and attach a dropper to a toy car, which is released down the ramp. Students calculate and graph velocity and acceleration...
Curated OER
Testing the Waters
Eleventh graders examine a local body of water. In this science lesson, 11th graders collect water samples to test. Students analyze the data and make conclusions. Students create tables and graphs of the data.
Curated OER
Lesson 3: Vary Your Veggies and Focus on Fruits
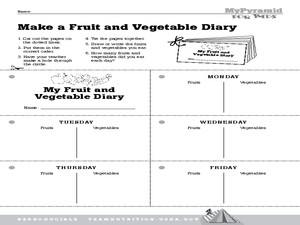
Learners explore fruits and vegetables. In this nutrition instructional activity, students generate a list of all known fruits and vegetables. Learners cut out and compile pages for a weekly fruits and vegetable journal. Students...
Curated OER
Results and Conclusions
Fourth graders practice using the scientific method. In this results and conclusions lesson, 4th graders review data collected, create a graph of their data and make their final conclusions about the information collected.
Curated OER
Interpreting Medical Data
Students explore human anatomy by graphing scientific data. In this vision lesson plan, students discuss how ophthalmology works and take their own eye assessment test using the Snellen chart. Students collect vision data from all of...
Curated OER
Decode Word Is..
Young scholars solve problems using patterns. In this algebra lesson, students identify the relation, domain and range of a function. They graph functions using coordinate pairs.
Curated OER
Temperature Effects on Solubility
Students determine the solubility of salt in water at three different temperatures and graph the results. They use the following skills: observing, inferring, and graphing.
Curated OER
What is My Favorite Apple?
Students decide on their favorite apple and together make a graph.
Curated OER
Are you an Energy Saver STAR?
Learners examine how to use energy more efficiently in their own home. They collect data from their home, complete a chart, read a power meter, interpret the data from an electric and gas bill, and create a poster demonstrating how to...
Curated OER
Measuring and Recording Weather
Students examine instruments used to measure weather, record the data, and post it to an online weather report. They include a 24 hour prediction, keep a weather log, and graph the data.
Curated OER
Understanding Cloud Formation
Learners view a demonstration that simulates cloud formation. They read a poem about clouds, participate in a class demonstration using warm water and ice and write a paragraph summarizing their observations.
Curated OER
Friction of a Block Weight
Fifth graders hypothesize and design an experiment to study the relationship between a block weight and the number of washers it takes to pull a block across various surfaces. Students graph results and apply their findings to a...
Curated OER
May The Force Be With You
Eighth graders investigate Newton's Laws of Motion. They use the example of a roller coaster for illustration purposes. A force associated with a roller coaster is tested, data graphed, and a conclusion is drawn. They use excel in order...
Curated OER
Activity #3 Finding Mass
Learners use graph paper to construct a graph and determine the slope of a straight line. They determine the weight (mass) of paper clips with a pan balance. Pupils weigh an unknown number of paper clips, and to interpret the graph to...
Curated OER
The Effect of Rain on Morning Temperatures
Eighth graders study the effects of the water cycle. They create a graph of the air temperature versus solar radiation on a rainy and clear 24 hour period using data from a provided link. Afterward, they answer questions to determine the...
Curated OER
Determining the Age of Fossils
High schoolers examine the concept of radioactive dating. In this radioactive dating instructional activity, students investigate how to determine the ages of fossils and rocks as they learn about half-life radioactive decay.


