Curated OER
Candy Land Math
Students order numbers and sets of objects from 0 through 10 and organize and interpret information collected from the immediate environment. They read and interpret graphs usin real objects and the computer. Finally, students sort a...
Curated OER
Smarty Pants
Pupils graph the colour distribution found in a packet of Skittle lollies, M&M's, Smarties or similar sweets. Results are compared and recorded against the results of other class members.
Curated OER
Junk Food Math
Students use Skittles candies as they explore estimation and percentages. In this math lesson plan, students sort, count, and chart Skittles candies to learn about estimation and study percentages.
Curated OER
Can You Guess The Flavor?
Second graders conduct a tasting experiment. In this senses lesson, 2nd graders read The Five Senses and brainstorm different tastes. They work in pairs, one blindfolded and the other recording. The blindfolded student eats one skittle...
Curated OER
Fractions
Fourth graders explore fractions. They use Skittles and M&M's to practice adding and subtracting fractions. Students review the numerator and the denominator of fractions. They count the number of each color of Skittles and M&M's...
Curated OER
A Bar of Many Colors
Second graders use colored candies to collect data, construct double bar graphs, and find averages.
National Museum of Nuclear Science & History
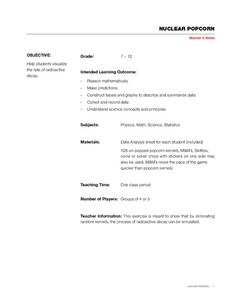
Nuclear Popcorn
Make your instructional activity on radioactive decay pop with this lab exercise. Using popcorn kernels spread over a tabletop, participants pick up all of those that point toward the back of the room, that is, those that represent...
Curated OER
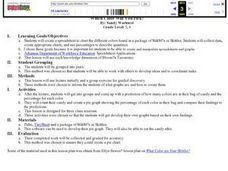
Which Color Will You Pick?
Students create a spreadsheet to chart the different colors found in a package of M&M's or Skittles. They collect data, create appropriate charts, and use percentages to describe quantities.
Curated OER
Data, Data, Everywhere... and What Am I To Think?
Students demonstrate good random sampling techniques for data collection, select and develop graphic presentations of data and analyze the data to solve a problem presented.
Curated OER
Candy Colors: Figuring the Mean, Median, and Mode
Students count candy by color and then calculate mean, median, and mode. They count candy and use the data to calculate mean, median, and mode (by color) and apply their learning to another collection of data.
Curated OER
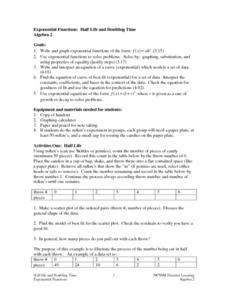
Exponential Functions: Half Life and Doubling Time
Pupils investigate the concept of exponential functions and how they increase in size over time. They simplify the functions in order to find the solutions that are possible and perform analysis of the curved line that is produced when...


